
Predicting market movements can feel like trying to read tea leaves. It’s tough, and there’s no magic formula. But if you know how to use options trading, you can get some pretty good insights into where things might be headed. This article breaks down different methods and strategies to help beginners get a grip on market predictions using options. From understanding basic analysis techniques to applying them in your trading plan, we’ll cover it all.
Key Takeaways
- Market prediction involves various techniques like fundamental, technical, and sentiment analysis.
- Options trading can reflect market sentiment and help you gauge potential price movements.
- Understanding price action can provide valuable insights for timing your trades effectively.
- Beginners should focus on risk management and avoid common pitfalls in options trading.
- Analyzing volatility and using tools like VIX can enhance your predictions and trading strategies.
Understanding Market Prediction Techniques
Predicting market movements is tough, but it’s not impossible. People use different methods to try and figure out where the market is headed. Let’s look at some common ones.
Fundamental Analysis Basics
Fundamental analysis is like looking at a company’s report card. It involves checking a company’s financial statements to see if it’s a good investment. You look at things like revenue, earnings, and debt. The idea is that if a company is doing well, its stock price should eventually reflect that. It’s a long-term approach, focusing on the intrinsic value of an asset. It also involves understanding the overall economy, government actions, and geopolitical events to guide investors on where the market may move.
Technical Analysis Overview
Technical analysis is all about charts and patterns. Instead of looking at a company’s financials, you look at its stock price and trading volume. The goal is to identify trends and predict future price movements based on past performance. Some investors won’t buy a stock or index that has risen too sharply, because they assume it’s due for a correction, while other investors avoid a falling stock because they fear it will continue to deteriorate. Key technical indicators include moving averages, Bollinger Bands, and the Relative Strength Index.
Sentiment Analysis in Trading
Sentiment analysis tries to gauge the overall mood of the market. Are people feeling greedy or fearful? This can be measured by looking at news articles, social media posts, and other sources of information. The idea is that market sentiment can influence buying and selling decisions, which in turn affects prices. It’s like taking the temperature of the market to see if it’s about to overheat or cool down. Understanding types of predictions based on recent pricing can help eliminate some biases.
No one can 100% correctly predict the market; however, there are tools that investors and traders can use to help make educated guesses on where the market may move. Using aspects of technical trading, such as stock charts and trading signals can help shed light on market movements.
Utilizing Options for Market Insights
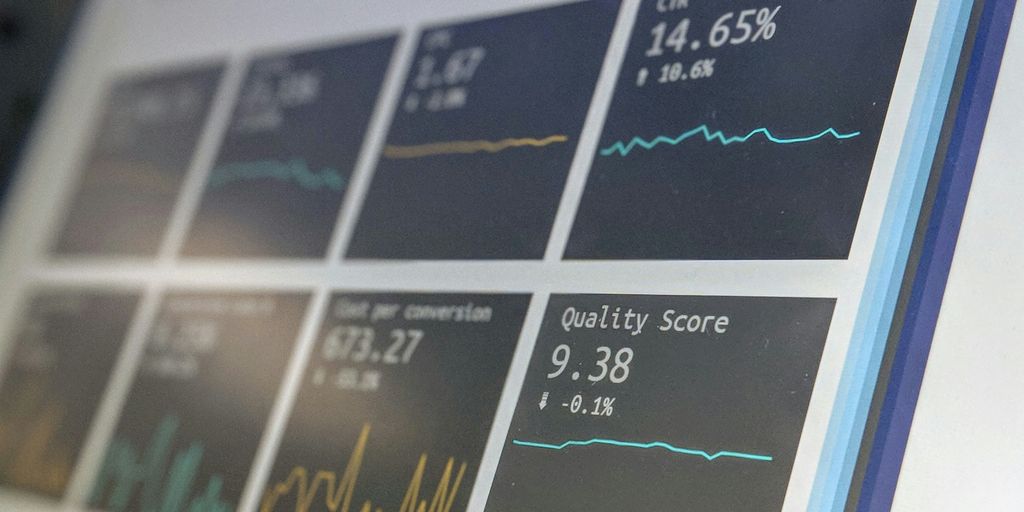
Options aren’t just for hedging or speculation; they can also provide valuable insights into market sentiment and potential future movements. It’s like peeking behind the curtain to see what the smart money is doing. Let’s explore how to use options to gain a better understanding of the market.
How Options Reflect Market Sentiment
Options prices are heavily influenced by what traders expect to happen. A high demand for call options suggests a bullish outlook, while increased put buying can signal bearish expectations. It’s not always a perfect predictor, but it’s a useful piece of the puzzle. For example, if you see a lot of people buying calls on a particular stock, it could mean that there’s a growing belief that the stock price will go up. This information can be used to inform your own trading decisions.
Interpreting Open Interest
Open interest refers to the total number of outstanding options contracts (both calls and puts) for a specific asset. A rising open interest generally confirms the current price trend, suggesting that more traders are entering positions in that direction. Conversely, a decline in open interest might indicate a weakening trend. Monitoring open interest can help you gauge the strength of a trend and identify potential reversals.
The Role of Implied Volatility
Implied volatility (IV) is a key metric derived from options prices that reflects the market’s expectation of future price fluctuations. High IV suggests that traders anticipate significant price swings, while low IV indicates a period of relative calm. Changes in IV can signal shifts in market sentiment and potential trading opportunities. For instance, a sudden spike in IV might suggest an upcoming event or announcement that could significantly impact the underlying asset’s price. Understanding implied volatility is important for market predictions.
Options data can be a powerful tool for predicting market direction, but it’s important to remember that it’s not a crystal ball. It’s just one piece of information that should be considered alongside other forms of analysis. Don’t rely solely on options data to make your trading decisions.
Price Action and Its Importance in Trading
Defining Price Action
Price action is basically how the price of something moves over time. It’s all about watching the actual price on a chart, instead of relying too much on other indicators. Understanding price action means you’re trying to figure out what the market is doing right now, not what it did in the past according to some calculation. It’s like reading the market’s mind, trying to anticipate its next move. This approach can be very useful for price action trading, which combines technical analysis with personal decision-making.
Historical Context of Price Action
Price action isn’t some newfangled idea. It’s been around for ages. Think about the old-school traders who used to sit in trading pits, watching the ticker tape. They were basically reading price action before computers were even a thing.
- Charles Dow, of Dow Jones fame, laid some of the groundwork with his Dow Theory.
- Jesse Livermore, a legendary trader, made a fortune by "reading the tape" and understanding price movements.
- These guys didn’t have fancy software, just their wits and an understanding of how prices move.
Price action analysis has deep roots in market history. Understanding these patterns is foundational to applying price action in trading.
Price Action Patterns to Watch
There are certain patterns that price action traders look for. These patterns can give clues about where the price might go next. Some common ones include:
- Dojis: These can signal potential reversals.
- Hammers: Another reversal signal, especially after a downtrend.
- Engulfing Patterns: These can indicate a change in trend direction.
It’s not just about memorizing patterns, though. It’s about understanding what they mean in the context of the overall market. Identifying support and resistance levels is also key. These are areas where the price tends to bounce or reverse, and they can be great spots to set entry and exit points for trades. Drawing trendlines helps visualize the direction of the market, while channels provide insights into the strength of a trend.
Strategies for Beginners in Options Trading
Choosing the Right Options Strategy
Starting with options can feel like stepping into a maze, but it doesn’t have to be overwhelming. The key is to begin with strategies that match your risk tolerance and understanding of the market. For instance, a covered call is often recommended for beginners because it’s relatively low-risk and helps you generate income from stocks you already own. On the other hand, buying a simple call or put option can be a good way to speculate on the direction of a stock without risking a lot of capital. It’s important to understand the potential profit and loss scenarios for each strategy before you put any money on the line. Consider exploring options trading strategies that align with your investment goals.
Risk Management Techniques
Risk management is absolutely critical when trading options. It’s not just about limiting losses; it’s about protecting your capital and ensuring you can continue to trade another day. Here are a few techniques to consider:
- Position Sizing: Never allocate more than a small percentage of your trading capital to any single trade. A common rule is to risk no more than 1-2% of your capital on a single trade.
- Stop-Loss Orders: Use stop-loss orders to automatically exit a trade if it moves against you. This helps to limit your potential losses.
- Defined Risk Strategies: Stick to strategies where your maximum potential loss is known upfront. Examples include covered calls, credit spreads, and debit spreads.
Understanding the risks involved in each options strategy is paramount. Before placing a trade, ask yourself: What’s the maximum I could lose? Am I comfortable with that potential loss? If the answer is no, then the strategy may not be right for you.
Common Mistakes to Avoid
New options traders often make similar mistakes. Being aware of these pitfalls can help you avoid them and improve your trading performance.
- Overtrading: Trading too frequently can lead to increased transaction costs and emotional decision-making. Stick to your trading plan and only trade when you see a clear opportunity.
- Ignoring Implied Volatility: Implied volatility can have a significant impact on options prices. Be aware of the current level of implied volatility and how it might affect your trades.
- Failing to Manage Positions: Don’t just set it and forget it. Actively manage your positions by adjusting stop-loss orders, taking profits when appropriate, and rolling positions if necessary.
Analyzing Volatility for Better Predictions
Volatility is a key ingredient in the options trading world. It’s not just about whether a stock goes up or down, but how much it moves, and how quickly. Understanding volatility can give you a serious edge in predicting market movements and crafting effective options strategies. Let’s break down how to use volatility to your advantage.
Understanding Market Volatility
Market volatility refers to the degree of variation in a trading price series over time. High volatility means prices can change dramatically over short periods, while low volatility suggests more stable, gradual price movements. It’s important to remember that volatility isn’t inherently good or bad; it simply presents opportunities and risks. You can measure volatility using historical data, but more importantly, you can gauge future expectations using options prices.
Using VIX for Market Predictions
The VIX, or Volatility Index, is often called the "fear gauge" because it reflects market expectations of volatility over the next 30 days. It’s derived from the prices of S&P 500 index options. A high VIX generally indicates increased uncertainty and fear, while a low VIX suggests complacency. However, it’s not a crystal ball. The implied volatility represents the options market’s estimation of future volatility, but it is not a guaranteed prediction.
Here’s a quick guide to interpreting VIX levels:
- Low VIX (below 15): Markets are generally stable, and sentiment is bullish. Option premiums are lower.
- Moderate VIX (15-25): Normal market fluctuations. Good for range-bound trading strategies.
- High VIX (above 25-30): Market uncertainty is high, and option premiums are expensive.
It’s a mistake to use the VIX as a direct predictor of market direction. Instead, think of it as a gauge of market sentiment and potential risk. A rising VIX doesn’t automatically mean the market will crash, but it does suggest that traders are anticipating larger price swings.
Adjusting Strategies During Volatility
When volatility spikes, it’s time to reassess your positions and potentially adjust your strategy. Here are a few things to consider:
- Adjusting your position size: Not adjusting your position size based on the current levels of VIX can result in traders risking too much capital and leaving them open to more risk than is necessary.
- Consider hedging: Use VIX futures, ETFs, or options to hedge your existing positions. This can help protect your portfolio during periods of high uncertainty.
- Avoid buying options outright: High implied volatility inflates option prices. Buying simple calls or puts can be risky because of the potential for losses due to volatility or time decay.
Volatility is a powerful tool for options traders, but it requires careful analysis and a well-defined strategy. By understanding how to interpret volatility and adjust your approach accordingly, you can improve your chances of success in the market.
Backtesting Strategies for Market Prediction
Importance of Historical Data
Okay, so you’ve got this awesome options trading strategy, right? Before you go all-in, you need to see how it would’ve performed in the past. That’s where historical data comes in. Think of it as your time machine. You can throw your strategy into different market conditions from years ago and see if it sinks or swims. No crystal ball needed, just good old data.
How to Backtest Effectively
Backtesting isn’t just about plugging in numbers and hoping for the best. You’ve gotta be smart about it. Here’s the deal:
- Get good data: Garbage in, garbage out. Make sure your historical data is accurate and complete.
- Define your rules: Be super clear about when you’d enter and exit a trade. No wishy-washy stuff.
- Account for slippage and commissions: These costs eat into your profits in the real world, so don’t ignore them in your backtest.
- Use realistic position sizing: Don’t bet the farm on every trade in your backtest if you wouldn’t do it in real life.
Backtesting is a simulation, not a guarantee. Past performance doesn’t always predict future results, but it gives you a much better idea of what to expect than just guessing.
Refining Your Trading Approach
So, your backtest is done. Now what? Well, hopefully, you’ve learned something. Maybe your strategy works great in bull markets but gets crushed when things get volatile. Or maybe you need to tweak your entry and exit points. The point is, backtesting lets you identify weaknesses and improve your strategies before you risk real money. It’s like practicing free throws before the big game. You wouldn’t go into a final without practicing, would you?
Here’s a simple table to illustrate potential backtesting results:
| Metric | Strategy A | Strategy B |
|---|---|---|
| Win Rate | 60% | 45% |
| Average Profit | $500 | $800 |
| Average Loss | $200 | $300 |
| Max Drawdown | $1000 | $1500 |
| Net Profit (Year) | $20,000 | $22,000 |
Based on this, Strategy B might look better due to higher net profit, but consider the higher max drawdown. It’s all about finding what fits your risk tolerance.
Developing a Trading Plan Based on Predictions
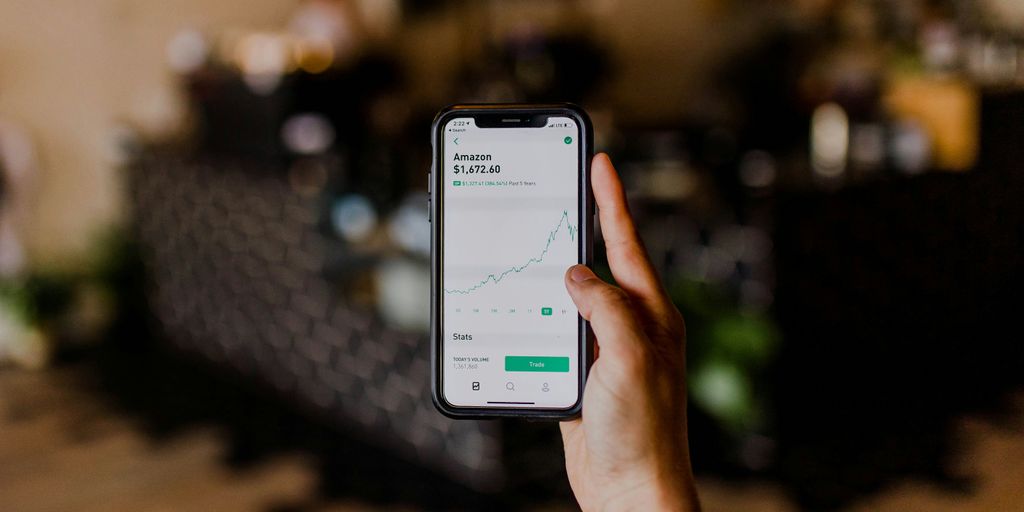
Setting Clear Goals
Before diving into the market, it’s important to define what you want to achieve. Are you aiming for steady income, capital growth, or something else? Your goals will shape your trading style and risk tolerance. For example, someone seeking income might focus on selling covered calls, while someone aiming for growth might prefer buying leveraged call options. Be realistic; overnight riches are rare. Set achievable, measurable targets, like a specific percentage return per month or quarter. This helps you track progress and stay motivated.
Incorporating Market Analysis
Your trading plan should be built on a solid foundation of market analysis. This means using the techniques we’ve discussed, such as fundamental, technical, and sentiment analysis, to form a view of where the market is headed. Don’t rely on gut feelings or rumors. Instead, use data and evidence to support your decisions. For instance, if you believe a stock will rise based on strong earnings and positive analyst ratings, your plan should outline how you’ll use options to profit from that move. Consider using a trading journal to document your analysis and track the performance of your predictions.
Monitoring and Adjusting Your Plan
The market is dynamic, and your trading plan should be too. Regularly review your plan to see if it’s still aligned with your goals and market conditions. Are your predictions proving accurate? Are your risk management strategies working? If not, be prepared to make changes. This could involve adjusting your position sizes, modifying your entry and exit points, or even switching to a different trading strategy altogether. Don’t be afraid to admit when you’re wrong and learn from your mistakes.
A good trading plan isn’t set in stone. It’s a living document that evolves as you gain experience and the market changes. The key is to stay flexible, disciplined, and always be willing to learn.
Here’s a simple table to illustrate how you might adjust your plan based on market conditions:
| Market Condition | Initial Strategy | Adjustment |
|---|---|---|
| Bullish | Buy call options | Consider selling covered calls to generate income |
| Bearish | Buy put options | Explore strategies like bear call spreads to limit risk |
| Volatile | Straddles or strangles | Reduce position size to account for increased uncertainty |
Creating a solid trading plan is key to your success in the market. By making predictions based on research and trends, you can set clear goals and strategies that guide your trades. Don’t wait to take control of your financial future! Visit our website today to learn more about how to build your trading plan and start your journey toward financial freedom!
Wrapping It Up
So, there you have it. Predicting market movements with options isn’t a foolproof science, but it can give you a leg up. By keeping an eye on market data, understanding price action, and using tools like the VIX, you can make more informed decisions. Sure, it takes practice and a bit of trial and error, but that’s part of the game. Just remember, no one can predict the market with 100% accuracy. Stay flexible, keep learning, and adjust your strategies as you go. Happy trading!
Frequently Asked Questions
What methods can I use to predict market trends?
While no one can predict the market with total accuracy, there are tools that can help. Traders often use charts, signals, and news about the economy to guess where the market might go.
What are some key indicators in technical analysis?
Technical analysis looks at past prices to guess future movements. Some important indicators include moving averages and Bollinger Bands.
How can I use options to understand market feelings?
Options can show how traders feel about future price movements. For example, if many people are buying call options, it might mean they expect the price to go up.
What is implied volatility and why is it important?
Implied volatility shows how much traders think a stock’s price will change in the future. High implied volatility can mean bigger price swings, which is important for options trading.
How do I create a solid trading plan?
To make a good trading plan, set clear goals, analyze the market, and be ready to change your plan based on new information.
What should I avoid when trading options?
Common mistakes include not managing risk properly and jumping into trades without enough research. Always take time to understand the market before making decisions.