
Using historical data in options trading can really help you make better decisions. By looking at how options have performed in the past, you can spot trends, gauge market sentiment, and even test your trading strategies before putting real money on the line. In this article, we’ll break down how to effectively use historical data to improve your options trading game, especially if you’re just starting out.
Key Takeaways
- Historical data helps traders understand past price movements and market behavior.
- Analyzing trends from historical data can inform future trading decisions.
- Backtesting strategies with historical prices allows for performance evaluation before live trading.
- Identifying support and resistance levels using past data can guide entry and exit points.
- Always consider the limitations of historical data and use it alongside other market analysis tools.
Understanding The Importance Of Historical Data In Options Trading
Gaining Insights From Past Price Movements
Looking at how options have behaved in the past can really open your eyes. It’s like having a cheat sheet to understand how options react to different market situations. By digging into historical options prices, you can start to see how they move when the underlying asset’s price changes, or when volatility spikes. It’s not just about seeing the numbers; it’s about understanding the why behind those numbers. This understanding can be super helpful in making smarter choices about your trades.
Identifying Market Trends
Spotting trends is key in options trading, and historical data is your best friend here. By examining past historical options prices, you can uncover patterns that might not be obvious at first glance. Are there certain times of the year when a particular option tends to perform better? Are there specific economic events that usually cause a spike in volatility? Answering these questions can give you a leg up in predicting future price movements and making more informed trading decisions. It’s all about recognizing the rhythm of the market.
Evaluating Trading Strategies
Before you put real money on the line, it’s smart to test your trading strategies. Historical data lets you do just that. You can use past historical options prices to simulate trades and see how your strategy would have performed in different market conditions. This process, known as backtesting, helps you identify the strengths and weaknesses of your approach. It also allows you to fine-tune your strategy and increase your chances of success when you finally start trading for real.
Historical data is not a crystal ball, but it’s the closest thing we have to one in the world of options trading. It provides a foundation for making informed decisions, managing risk, and improving your overall trading performance. Ignoring it is like trying to navigate a maze blindfolded.
Steps To Analyze Historical Options Prices
Gathering Relevant Data
Okay, so you want to get into analyzing historical options prices? First things first, you need to actually get the data. This means figuring out exactly what you need. Are you looking at a specific stock? A certain time frame? The more specific you are, the easier it will be to find what you need. You can usually find this data through option exchanges, third-party providers, or even some financial platforms. Make sure the data is clean and reliable, because garbage in equals garbage out, right?
Utilizing Technical Analysis
Once you’ve got your data, it’s time to put it to work. This is where technical analysis comes in. Think of it as reading the tea leaves of the market. You’re looking for patterns, trends, and signals that might give you an edge. Common tools include:
- Charting: Plotting the data to visually identify trends.
- Moving Averages: Smoothing out price data to see the underlying direction.
- Oscillators: Tools like RSI and MACD to gauge momentum and potential overbought/oversold conditions.
Technical analysis isn’t a crystal ball, but it can help you make more informed decisions by providing a framework for understanding price movements.
Identifying Support And Resistance Levels
Support and resistance levels are key areas where the price has previously struggled to move beyond. Identifying these levels using historical options prices can give you potential entry and exit points for your trades. Support is where the price tends to bounce up, while resistance is where it tends to fall back down. These levels aren’t always perfect, but they can act as guideposts for your trading strategy. Look for areas where the price has repeatedly reversed direction. These are your zones of interest.
Backtesting Strategies With Historical Data
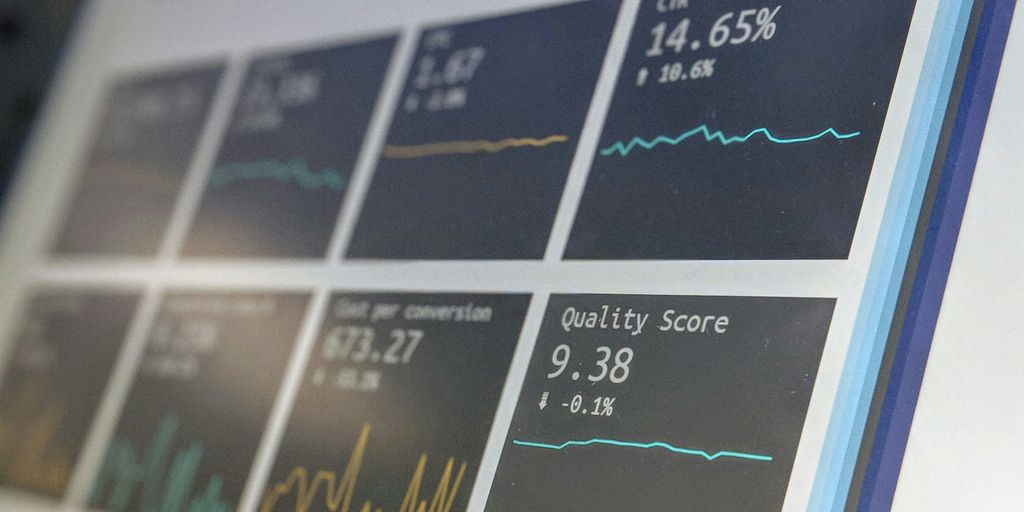
Backtesting is like a time machine for your trading ideas. It lets you see how a strategy would have performed in the past, without risking real money. It’s not a crystal ball, but it can give you a much better sense of whether your approach is likely to be profitable.
Simulating Past Trades
This is where the rubber meets the road. You take your trading strategy and apply it to historical data, step by step. Imagine you have a rule that says, "Buy a call option when the stock price crosses above its 50-day moving average." You’d go through the historical data, find every instance where that happened, and simulate buying the option. Then, you’d follow the strategy’s rules for selling the option, recording the profit or loss. This process is repeated across a wide range of historical data to get a comprehensive view of the strategy’s performance. It’s important to account for slippage and commissions to make the simulation as realistic as possible. This backtesting options strategies process helps refine your approach.
Evaluating Strategy Performance
Once you’ve simulated a bunch of trades, it’s time to crunch the numbers. Look at metrics like:
- Win Rate: What percentage of your trades were profitable?
- Average Profit/Loss: How much did you make or lose on average per trade?
- Maximum Drawdown: What was the biggest peak-to-trough decline in your portfolio value during the backtesting period?
- Profit Factor: The ratio of gross profit to gross loss. A profit factor above 1 indicates a profitable strategy.
These metrics will give you a good idea of the strategy’s strengths and weaknesses. A high win rate is great, but if the average loss is much bigger than the average win, you might still lose money in the long run. Maximum drawdown is especially important for risk management – it tells you how much capital you need to withstand the strategy’s worst-case scenario.
Refining Trading Approaches
Backtesting isn’t just about seeing if a strategy works; it’s about making it better. If the initial results aren’t great, don’t give up. Instead, use the backtesting data to identify areas for improvement. Maybe you need to adjust the entry or exit rules, or maybe the strategy only works well in certain market conditions. For example, you might find that a strategy performs well during periods of low volatility but struggles when volatility spikes. In that case, you could add a filter to only trade the strategy when volatility is below a certain level. Keep tweaking and re-testing until you’re satisfied with the results. Remember to ensure data quality for accurate results.
Backtesting is an iterative process. Don’t expect to find the perfect strategy on your first try. Be prepared to experiment, learn from your mistakes, and continuously refine your approach. The more time you spend backtesting, the better you’ll understand your strategy and the more confident you’ll be in its ability to generate profits.
Sources For Historical Options Prices Data
Option Exchanges
Many option exchanges themselves are a direct source. For example, the Chicago Board Options Exchange (CBOE) provides historical options data that includes daily prices for all optionable stocks and indices listed on their exchange, as well as select ETFs and futures. Accessing data directly from exchanges can be challenging, so it’s best if you have a large organization with a substantial engineering team.
Third-Party Data Providers
There are many third-party providers that specialize in options data. These providers handle the complexities of sourcing, cleaning, delivering, and supporting the data. They often deliver data through an easy-to-use API, supported by documentation and SDKs. This is a good option for anyone building investment apps, algorithms, or software.
Financial Data Platforms
Some financial data platforms also provide historical options data as part of their service. These platforms may offer historical data for their clients. The downside is that you can only look at it, as most of these platforms don’t provide API access or let you consume the raw data.
It’s important to research data providers thoroughly. Choosing an expensive, inflexible, or low-support provider can make or break your strategy.
Utilizing Historical Data For Risk Management
Assessing Historical Volatility
Historical data is super useful when you’re trying to figure out how risky an option is. By looking at how much the price of the underlying asset has moved around in the past, you can get a sense of how volatile it might be in the future. This is important because higher volatility usually means higher option prices, but also a greater chance of big swings in value. You can use this information to make smarter choices about which options to trade and how much to pay for them. Understanding options trading strategies is key to managing risk effectively.
Calculating Value-At-Risk
Value-At-Risk (VaR) is a way to estimate the potential loss in value of your options portfolio over a specific time period, given a certain confidence level. Basically, it tells you the worst-case scenario you should expect, say, 95% of the time. Historical data is essential for calculating VaR because it lets you simulate different market conditions and see how your portfolio would have performed. This helps you set appropriate stop-loss orders and adjust your position sizes to avoid getting wiped out by unexpected market moves. It’s not perfect, but it’s a good way to get a handle on your potential downside. You can find historical options prices from various sources.
Implementing Risk Mitigation Strategies
Once you’ve assessed the risks, it’s time to put some strategies in place to protect your capital. Here are a few ideas:
- Diversification: Don’t put all your eggs in one basket. Spread your investments across different assets and sectors to reduce the impact of any single event on your portfolio.
- Hedging: Use options to offset potential losses in your other investments. For example, if you own a stock, you could buy put options to protect against a price decline. Hedging can be complex, so make sure you understand the risks involved.
- Position Sizing: Adjust the size of your positions based on your risk tolerance and the volatility of the underlying assets. Smaller positions mean smaller potential losses.
Historical data is not a crystal ball. It can give you insights into potential risks, but it can’t predict the future with certainty. Always be prepared for the unexpected and have a plan in place to deal with adverse market conditions.
Best Practices For Beginners In Options Trading
Ensuring Data Quality
For beginners, it’s super important to make sure the historical data you’re using is actually good. Garbage in, garbage out, right? Check your data sources. Are they reliable? Are there any obvious errors or missing pieces? Don’t just blindly trust the numbers; do a little digging to confirm they make sense. This might involve cross-referencing with another source or just spot-checking a few key data points. It’s a bit tedious, but it can save you from making some seriously bad calls later on.
Understanding Limitations Of Historical Data
Historical data is great, but it’s not a crystal ball. Just because something happened in the past doesn’t mean it’s guaranteed to happen again. Markets change, conditions shift, and unexpected events can throw everything off. Think of it like driving a car: looking in the rearview mirror tells you where you’ve been, but it doesn’t tell you what’s around the next corner. Use historical data as a guide, not as a rulebook. Be aware of its limits, and always factor in the possibility of surprises. Market dynamics are always changing.
Using Visualization Tools
All those numbers can be overwhelming, so use charts and graphs to help you see what’s going on. Visualization tools can make it easier to spot trends, patterns, and potential opportunities. Experiment with different types of charts – line graphs, bar charts, scatter plots – to find what works best for you. Most trading platforms have built-in charting tools, or you can use free software like Google Sheets or dedicated charting packages. The goal is to turn raw data into something you can actually understand and use to make better trading decisions.
Don’t get bogged down in analysis paralysis. It’s easy to spend hours staring at charts and trying to predict the future, but at some point, you have to actually make a trade. Use historical data to inform your decisions, but don’t let it paralyze you. Remember, even the best analysis is just an educated guess.
Here are some visualization tools to consider:
- Line graphs for spotting trends over time.
- Bar charts for comparing data across different categories.
- Scatter plots for identifying correlations between variables.
Leveraging Historical Data For Predictive Analysis

Historical data isn’t just about looking back; it’s a powerful tool for peering into the future. By carefully examining past market behavior, traders can develop strategies to anticipate potential price movements and capitalize on emerging opportunities. It’s like having a crystal ball, but instead of magic, it’s based on cold, hard numbers.
Identifying Patterns And Trends
Historical data allows you to spot recurring patterns and trends in market behavior. Analyzing past price movements, trading volumes, and volatility levels can reveal market cycles and seasonal trends. This information can be invaluable for making informed investment decisions. For example, you might notice that a particular stock tends to perform well during a specific quarter, or that certain economic events consistently trigger specific market reactions. Recognizing these patterns can give you a significant edge.
Utilizing Predictive Modeling
Predictive modeling takes historical data analysis to the next level by using statistical techniques to forecast future price movements. This involves building models that identify relationships between different variables and then using those relationships to predict future outcomes. These models can range from simple linear regressions to complex machine learning algorithms. The key is to find a model that accurately captures the underlying dynamics of the market. You can use algorithmic trading to automate the execution of trades based on the predictions generated by these models.
Incorporating Market Indicators
Market indicators are statistical measures that provide insights into the overall health and direction of the market. These indicators can be used in conjunction with historical data to improve the accuracy of predictive models. Some common market indicators include:
- Moving averages
- Relative Strength Index (RSI)
- Moving Average Convergence Divergence (MACD)
- Volatility Index (VIX)
By incorporating these indicators into your analysis, you can gain a more comprehensive understanding of market dynamics and make more informed trading decisions.
It’s important to remember that predictive analysis is not an exact science. While historical data can provide valuable insights, it’s impossible to predict the future with certainty. Market conditions can change rapidly, and unexpected events can always throw a wrench into the works. Therefore, it’s crucial to use predictive analysis as just one tool in your trading arsenal, and to always manage your risk carefully.
Using past data can help us make smart guesses about what might happen in the future. By looking at trends and patterns from previous years, we can better understand how to make good choices in trading. If you want to learn more about how to use this information to improve your trading skills, visit our website today!
Wrapping It Up
In conclusion, using historical options prices can really help you make smarter trading choices. By looking back at how options have behaved in the past, you can spot trends and patterns that might repeat. This can give you a leg up when deciding how to trade. Just remember, while historical data is useful, it doesn’t guarantee future results. Markets change, and what worked before might not work again. So, keep an eye on the current market and adjust your strategies as needed. If you take the time to analyze this data carefully, you could improve your chances of success in options trading.
Frequently Asked Questions
What is historical data in options trading?
Historical data in options trading refers to past prices and performance of options contracts. Traders use this data to understand how options have reacted to changes in the market.
Why is historical data important for options traders?
Historical data helps traders identify trends and patterns, evaluate their trading strategies, and make better decisions based on past market behavior.
How can I analyze historical options prices?
You can analyze historical options prices by gathering data, using technical analysis tools, and identifying key support and resistance levels.
What is backtesting in options trading?
Backtesting is the process of simulating trades using historical data to see how a trading strategy would have performed in the past.
Where can I find historical options prices?
You can find historical options prices from option exchanges, third-party data providers, and financial data platforms.
How can historical data help with risk management?
Historical data helps traders assess past volatility, calculate potential risks, and create strategies to protect their investments.