
Thinking about trading weekly options? It can be a bit tricky, and just jumping in without a plan is a recipe for disaster. That’s where backtesting comes in. It’s basically like a practice run for your trading ideas, using old market data to see how your strategy would have done. This way, you can figure out what works and what doesn’t before you risk your actual money. We’ll walk through how to do it right, from picking the best tools to understanding the results.
Key Takeaways
- Backtesting weekly options lets you test your trading ideas using historical data to see how they might perform.
- Having a clear, defined strategy with specific entry and exit rules is the first step before you even start backtesting.
- Choosing the right software and making sure your historical data is accurate are super important for reliable backtesting results.
- Analyzing the numbers from your backtests, like profit and loss, helps you find what’s working and what needs fixing in your strategy.
- Don’t just backtest once; keep tweaking your strategy based on the results and then test again to make it better over time.
Understanding The Core Of Backtesting Weekly Options
So, you’re looking to get into weekly options trading, huh? It’s a fast-paced game, and before you put any real money on the line, you’ve got to know if your plan actually works. That’s where backtesting comes in. Think of it like a dress rehearsal for your trading strategy. We’re not just guessing here; we’re using past market data to see how our ideas would have played out.
Defining Backtesting And Its Importance
Backtesting is basically running your trading strategy on historical market data to see how it would have performed. It’s a way to test your rules and see if they make sense before you risk your hard-earned cash. It’s about building confidence in your approach by looking at what happened before. Without it, you’re essentially flying blind. You might have a great idea, but does it hold up when the market does its thing?
Benefits Of Backtesting In Trading
Why bother with all this historical data analysis? Well, there are a few good reasons:
- Strategy Validation: Does your strategy actually make money over time, or is it just a nice theory?
- Risk Assessment: How much could you have lost during bad periods? This helps you understand the potential downsides.
- Parameter Tuning: You can tweak things like entry points or stop-loss levels to see what works best.
- Psychological Comfort: Seeing a strategy perform well historically can give you the confidence to stick with it when real trading gets stressful. It helps you avoid jumping ship too early.
Types Of Backtesting Methodologies
There are a few ways to go about backtesting, each with its own flavor:
- Simple Backtesting: This is often done with spreadsheets. You manually go through historical data, apply your rules, and record the results. It’s basic but can be effective for simpler strategies.
- Software-Based Backtesting: This involves using specialized trading platforms or software that can automatically run your strategy against historical data. This is much faster and more thorough, especially for complex strategies. Many platforms offer tools for selling weekly options.
- Event-Driven Backtesting: This method focuses on specific market events, like earnings announcements or news releases, to see how your strategy reacts. It’s more advanced and requires detailed data on these events.
You need to be careful not to over-optimize your strategy to fit the historical data too perfectly. If you tweak it too much based on past results, it might not work well in the future when market conditions change. It’s a balance between making it work and keeping it adaptable.
Ultimately, backtesting is your chance to learn from the past so you can trade better in the future. It’s a critical step for anyone serious about weekly options.
Preparing Your Weekly Options Strategy For Backtesting
Alright, so you’ve got this idea for a weekly options strategy. That’s cool. But before you even think about putting real money on the line, you gotta make sure it’s not just a pipe dream. This is where preparing your strategy for backtesting comes in. It’s like getting your car ready for a race – you wouldn’t just show up with bald tires, right?
Crafting a Defined Trading Strategy
First things first, you need a plan. A real plan, not just a vague idea. What exactly are you trying to do with these weekly options? Are you looking for quick, small wins, or are you okay with holding on a bit longer for a bigger payout? You gotta nail down the specifics.
- Entry Signals: What tells you it’s time to buy a call or a put? Is it a specific indicator crossing a certain level? A particular chart pattern forming?
- Exit Signals: When do you sell? Do you have a profit target? A stop-loss level? Or maybe an exit based on time, like selling before expiration?
- Risk Management: This is huge. How much are you willing to lose on any single trade? How much capital are you risking overall? You need hard rules here.
You can’t just wing it. A solid strategy has clear, objective rules that you can follow without thinking too much. This removes emotion, which is usually the enemy of good trading.
Selecting Appropriate Backtesting Software
Now, you need a tool to test this plan. There are tons of options out there, from simple spreadsheets to fancy software. For weekly options, you’ll want something that can handle the fast-paced nature of these contracts.
- Data Handling: Can it import and process historical options data, including strike prices, expiration dates, and bid/ask prices? This is non-negotiable.
- Customization: Can you code your specific entry and exit rules into it? Or does it have built-in tools that let you set up your strategy easily?
- Reporting: What kind of results does it give you? You need detailed performance metrics, not just a final profit number.
Some folks use platforms like Thinkorswim for its charting and analysis, while others might go for more advanced coding environments like Python with libraries such as pandas and backtrader if they want total control.
Gathering and Validating Historical Data
This is where the rubber meets the road. You need good data to test against. Garbage in, garbage out, as they say.
- Source: Where are you getting your historical options data? Is it from your broker, a data vendor, or a free source? Make sure it’s reliable.
- Completeness: Does the data cover the time periods you want to test? Does it include all the necessary details like open, high, low, close, volume, and open interest for the options contracts?
- Accuracy: This is the tricky part. You need to check if the data is clean. Are there any gaps? Any weird price spikes that don’t make sense? You might need to do some cleaning yourself, especially with options data which can be a bit messy.
The quality of your historical data directly impacts the reliability of your backtest results. If your data is flawed, your conclusions will be too. It’s worth spending time here to make sure you’re testing against realistic market conditions.
Implementing Your Strategy In Backtesting Tools

Alright, so you’ve got your strategy all mapped out, and you’ve picked out some software to run the tests. Now comes the part where you actually plug everything in and see what happens. It’s like setting up a science experiment, but instead of chemicals, you’re using market data.
Configuring Strategy Parameters
This is where you tell the software exactly how your strategy works. Think of it as giving the computer a detailed instruction manual. You’ll need to input things like:
- Entry and Exit Rules: What specific conditions must be met for the strategy to open or close a trade? This could be based on technical indicators crossing, price levels being breached, or a combination of factors.
- Risk Management: How much are you willing to risk per trade? This includes setting stop-loss levels and position sizing rules. Getting these right is super important for not blowing up your account.
- Indicator Settings: If your strategy uses indicators like Moving Averages or RSI, you’ll need to specify the periods and settings for each.
It’s really about translating your trading plan into a language the software understands. Every little detail matters here, so double-check everything.
Choosing the Right Historical Data Periods
Selecting the right historical data is like picking the right ingredients for a recipe. You want data that’s relevant to your strategy and the market conditions you expect to trade in. For weekly options, you might want to look at data covering different market regimes – periods of high volatility, low volatility, trending markets, and sideways markets. This helps you see how your strategy holds up under various circumstances.
- Data Granularity: For weekly options, you might need data that’s at least daily, but sometimes even intraday data can be useful for understanding intra-week price action.
- Data Span: How far back should you go? A few years is usually a good starting point, but more data can give a broader picture. Just make sure the data is clean and accurate.
- Data Quality: Garbage in, garbage out, right? Make sure your historical data is reliable. You can find good historical data from various providers, and some backtesting platforms offer it directly. It’s worth exploring different backtesting software platforms to see what data they provide.
You need to be careful not to just pick data that makes your strategy look good. That’s a common mistake. The goal is to test your strategy realistically, not to find data that fits your desired outcome.
Executing Backtests With Precision
Once everything is set up, it’s time to run the test. This is where the software simulates your strategy trading through the historical data you’ve provided. You’ll want to run multiple tests, perhaps varying the data periods or even making small tweaks to parameters to see how sensitive your strategy is to changes.
- Run Multiple Simulations: Don’t just run one test. Run several, perhaps using different time frames or slightly different parameter sets, to get a more robust understanding of your strategy’s potential performance.
- Document Everything: Keep a record of each test you run, including the parameters used, the data period, and the results. This will be invaluable later when you’re analyzing and optimizing.
- Watch for Overfitting: Be mindful that if you tweak your parameters too much based on the historical data, you might end up with a strategy that only works on that specific data and won’t perform well in live trading. This is a big pitfall to avoid.
Executing these tests carefully and systematically is key to getting meaningful results that you can actually use to improve your trading.
Analyzing Backtesting Results For Weekly Options
So, you’ve run your backtests. Now comes the really important part: figuring out what all those numbers actually mean for your weekly options strategy. It’s not just about seeing if you made money; it’s about understanding how and why.
Evaluating Key Performance Metrics
Looking at the raw output from your backtesting software can be overwhelming. You need to focus on the metrics that tell the real story. Think of it like a doctor reviewing test results – you’re looking for specific indicators of health and potential problems.
Here are some of the must-watch metrics:
- Net Profit/Loss: The bottom line. Did the strategy make or lose money over the tested period?
- Win Rate: What percentage of trades were profitable?
- Average Profit per Winning Trade: How much did you typically make on a winning trade?
- Average Loss per Losing Trade: How much did you typically lose on a losing trade?
- Profit Factor: This is the gross profit divided by the gross loss. A profit factor above 1 means you’re making more than you’re losing.
- Maximum Drawdown: This is the largest peak-to-trough decline in your portfolio value during the backtest. This tells you the biggest hit your account could have taken.
- Sharpe Ratio: This measures risk-adjusted return. A higher Sharpe Ratio generally indicates a better performance relative to the risk taken.
It’s also helpful to see how these play out over time. A simple table can show this:
| Metric | Value |
|---|---|
| Total Trades | 150 |
| Winning Trades | 90 |
| Losing Trades | 60 |
| Net Profit | $5,200 |
| Max Drawdown | -15% |
| Profit Factor | 1.8 |
| Average Win ($) | $350 |
| Average Loss ($) | $200 |
Identifying Strategy Strengths and Weaknesses
Once you have the numbers, you need to interpret them. Where did your strategy shine, and where did it fall short? Maybe your strategy has a high win rate but small wins and large losses, leading to a low profit factor. Or perhaps it has fewer trades but very consistent, albeit small, profits.
Consider these questions:
- Does the strategy perform better in trending markets or sideways markets?
- Are there specific times of day or week when it consistently loses money?
- Are your winning trades significantly larger than your losing trades, or are you relying on a high win rate?
- How does the maximum drawdown compare to your risk tolerance?
Understanding why a strategy works or doesn’t work is more important than just looking at the final profit number. It’s about building a robust system, not just getting lucky once.
Comparing Performance Against Goals
Remember those objectives you set when you first crafted your strategy? Now’s the time to see if your backtested results line up. If your goal was to achieve a 10% annual return with no more than a 15% drawdown, how did your backtest results stack up?
- Did you meet your profit targets?
- Did you stay within your acceptable risk limits (drawdown)?
- Was the number of trades executed in line with your expectations?
If the results don’t match your initial goals, don’t get discouraged. This is where the optimization process begins. It’s a feedback loop: backtest, analyze, adjust, and repeat. The goal is to refine your approach until it aligns with your trading plan and risk appetite.
Optimizing Your Weekly Options Strategy
So, you’ve run your backtests and looked at the numbers. Now comes the really interesting part: making your strategy better. It’s not enough to just see what happened; you need to figure out how to make it work even harder for you. This is where we tweak things based on what the backtests told us.
Refining Parameters Based On Insights
After you’ve crunched the data, you’ll start to see patterns. Maybe your stop-loss orders were a bit too tight, or perhaps your profit targets were too ambitious for certain market conditions. It’s about taking those observations and making small, targeted changes. For instance, if you noticed your strategy lost money during periods of high implied volatility, you might adjust the parameters related to your entry or exit points when volatility spikes. The goal is to make your strategy more resilient.
Here’s a quick look at common parameters you might adjust:
- Entry Triggers: When do you get into a trade? Maybe you need a stronger signal.
- Exit Triggers: When do you get out? This includes stop-losses and profit targets.
- Position Sizing: How much capital do you allocate per trade?
- Time Decay Management: How do you handle options losing value over time?
Testing Strategy Variations
Sometimes, just tweaking parameters isn’t enough. You might need to test entirely different approaches or variations of your core strategy. This could involve changing the types of options you trade (e.g., focusing on out-of-the-money vs. at-the-money options) or altering the underlying assets you trade. Think of it like trying different recipes to see which one tastes best. You might discover that a slightly different setup performs much better under specific market conditions. This is a great way to explore new possibilities and improve your trading performance.
Balancing Risk And Return Effectively
This is the big one, right? You want to make money, but you don’t want to risk everything to do it. Backtesting helps you find that sweet spot. You can look at metrics like the Sharpe Ratio or Sortino Ratio to understand how much return you’re getting for the amount of risk you’re taking. It’s a constant balancing act. You might find that a strategy with slightly lower returns but much lower risk is actually a better fit for your long-term goals. It’s about building a strategy that’s not just profitable, but also sustainable over time.
You’re not just looking for the highest possible profit; you’re looking for the most consistent and reliable profit relative to the risk you’re willing to accept. This often means accepting slightly lower potential gains in exchange for significantly reduced downside.
Remember, optimization is an ongoing process. The market changes, and your strategy needs to adapt with it. Keep testing, keep refining, and you’ll be well on your way to mastering weekly options.
Integrating Backtesting Into Your Trading Routine
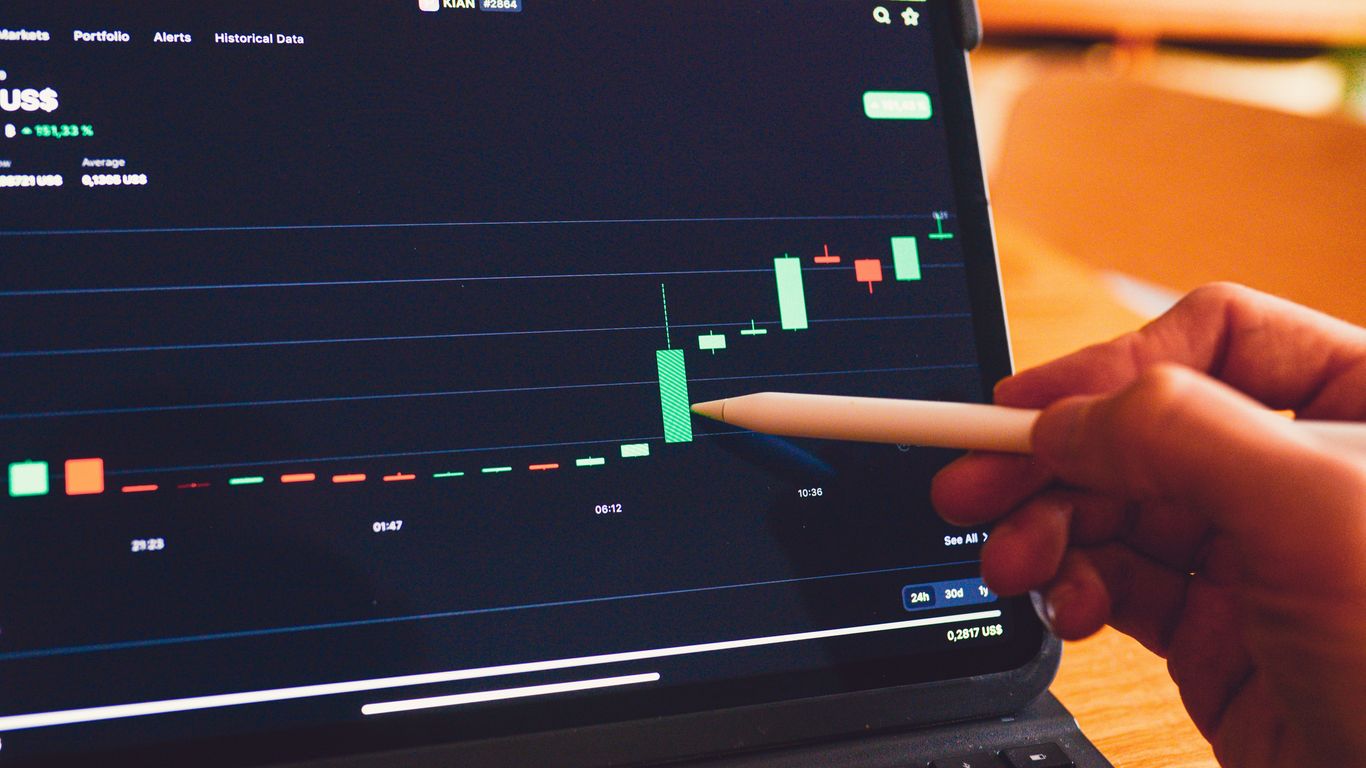
So, you’ve gone through the whole process: crafting a strategy, picking the right software, gathering data, and running those backtests. That’s awesome! But backtesting isn’t just a one-and-done thing. To really make it work for you, you’ve got to weave it into your regular trading life. It’s like practicing scales on a guitar; you don’t just do it once and expect to be a rockstar. You gotta keep at it.
Forward Testing for Real-World Validation
Before you jump headfirst into live trading with a strategy that looked great on paper (or, well, on your backtesting software), you need to see how it holds up in the actual market. This is where forward testing, sometimes called paper trading, comes in. It’s basically simulating your strategy in real-time, but with fake money. You’re not risking anything, but you’re also not getting any real profits. It’s a crucial step to make sure your backtested results aren’t just a fluke. You want to see if your strategy performs similarly when the market is actually moving, not just when you’re looking at historical charts. This helps catch any issues that might pop up due to real-time execution, slippage, or just the general chaos of live markets. It’s a good way to build confidence before you commit real capital.
Continuous Monitoring and Adaptation
Markets change, and your strategy needs to keep up. Once you start trading live, you can’t just set it and forget it. You need to keep an eye on how your strategy is performing day-to-day, week-to-week. Are the results still lining up with what your backtests predicted? Are there any new patterns emerging that your strategy isn’t catching? This is where keeping a trading journal becomes super helpful. You can track your trades, note down any deviations from your plan, and look for trends in your performance. If you notice your win rate dropping or your average loss increasing, it’s a sign that something might need adjusting. The goal is to be proactive, not reactive. Regularly reviewing your performance metrics, like your win percentage and average profit per trade, helps you stay on top of things. This continuous feedback loop is what separates traders who just guess from those who trade with a plan.
Making Informed Trading Decisions
Ultimately, the whole point of backtesting and forward testing is to make better trading decisions. When you have solid data showing how your strategy has performed under various conditions, you can approach the market with more confidence. You’ll know when to enter a trade based on your defined rules, when to exit to lock in profits or cut losses, and how much capital to allocate to each trade. It’s about removing emotion from the equation as much as possible. Instead of making impulsive decisions based on fear or greed, you’re relying on the objective insights gained from your testing. This disciplined approach can significantly improve your consistency and help you manage risk more effectively. Remember, even the best strategies need careful management, and integrating testing into your routine is the best way to achieve that consistent income.
Here’s a quick look at what to monitor:
- Performance Metrics: Keep an eye on your win rate, average profit/loss per trade, and maximum drawdown.
- Market Conditions: Note any significant shifts in market volatility or trends that might affect your strategy.
- Execution Quality: Are your trades being filled at the prices you expect? Slippage can eat into profits.
- Strategy Deviations: Are you sticking to your plan, or are you tempted to make emotional adjustments?
Making sure your trading plan works before you risk real money is super important. Testing your strategies, or backtesting, helps you see how they might do in the past. This way, you can fix any problems before they cost you. Want to learn more about making backtesting a regular part of your trading? Visit our website to get started!
Wrapping Up: Your Backtesting Journey
So, we’ve gone through how to test your trading ideas using past market data. It’s not always easy, and sometimes the results aren’t what you hoped for, but that’s the point, right? You learn what works and what doesn’t before you put real money on the line. Remember to keep your strategy clear, use the right tools, and don’t get too caught up in making it perfect for old data – the market always changes. Keep practicing, stay patient, and you’ll get better at this. Good luck out there.
Frequently Asked Questions
What is backtesting and why should I do it?
Backtesting is like looking at old game tapes for your trading ideas. You use past market information to see if your trading plan would have made money. It’s super important because it helps you understand if your strategy is good before you risk real money.
How do I get my trading strategy ready for backtesting?
First, you need a clear plan with specific rules for when to buy and sell, and how much risk you’re willing to take. Then, pick a good backtesting tool and make sure the historical data you use is accurate and covers the time periods you want to check.
What are some common mistakes people make when backtesting?
A big mistake is ‘look-ahead bias,’ which is using information you wouldn’t have known at the time. Another is ‘overfitting,’ where you tweak your strategy so much it only works on past data but not in the real world. Sticking to your rules is key!
How do I know if my backtesting results are good?
You need to look at important numbers like how much profit you made, how much you could have lost (drawdown), and how often you won trades. Compare these results to your original goals to see if your strategy is working as planned.
What is ‘forward testing’ and why is it important?
Forward testing is like a practice run in real-time, but with fake money (paper trading). It’s important because it shows you how your strategy actually works in current market conditions, which might be different from the past data you used for backtesting.
Should I keep backtesting even after I start trading for real?
Yes, definitely! Markets change, so you need to keep checking how your strategy is doing and make small adjustments if needed. It’s an ongoing process to make sure your trading plan stays effective over time.