
Setting weekly income goals can feel a bit like trying to catch lightning in a bottle. You see the potential for quick gains, but also the risk of it all slipping away. Many traders get drawn into the fast-paced world of weekly options, hoping for big wins, but end up feeling lost or stressed. It’s not about finding some secret trick to get rich fast, because that’s not really how trading works. This guide is here to help you get a handle on things, offering practical ways to approach weekly options trading. We’ll look at solid strategies and how to use them, so you can trade smarter and hopefully, more profitably.
Key Takeaways
- Weekly options expire on Fridays, offering shorter trading cycles. They generally have lower premiums but lose value faster than monthly options.
- Use tools like moving averages, RSI, and MACD, along with chart patterns like double tops and flags, to help find good entry points. These patterns can be quite reliable.
- Popular strategies for income include Covered Calls for steady premiums, Iron Condors when the market isn’t moving much, and Credit Spreads for trades with a specific direction.
- Managing risk is super important. Keep your trades small, usually 2-5% of your capital. Set stop-losses and understand how time affects your option’s value.
- Trade in markets with lots of activity, like the SPY ETF or big tech stocks (AAPL, MSFT). These usually have tighter price differences and are easier to trade.
Understanding Your Weekly Income Goal Setting
Setting weekly income goals for options trading isn’t just about picking a number; it’s about building a realistic plan that fits your trading style and your life. It’s easy to get caught up in the excitement of potential profits, but without a solid foundation, those goals can quickly become wishful thinking. We need to be practical here.
Defining Realistic Income Targets
When you’re aiming for weekly income, the first step is figuring out what’s actually achievable. This isn’t about chasing huge returns overnight. Think about what percentage of your trading capital you’re comfortable aiming for each week. A common guideline is to target a small, consistent percentage, maybe 1-3% of your capital weekly. This might not sound like much, but over time, it adds up. For example, if you have $10,000 in your trading account, a 1% weekly goal means aiming for $100. It sounds small, but it’s a concrete target.
Here’s a simple way to think about it:
- Calculate your total trading capital. This is the money you’ve set aside specifically for trading.
- Determine your desired weekly return percentage. Start low, like 1% to 3%.
- Multiply your capital by your desired percentage. This gives you your weekly dollar target.
Let’s say you have $25,000 and aim for 2% weekly. That’s $500 per week. This number should feel attainable, not like a lottery win. The key is consistency over massive wins.
Aligning Goals with Risk Tolerance
Your income goals need to match how much risk you’re willing to take. If you can’t sleep at night when your positions move against you, aiming for high weekly returns through aggressive strategies probably isn’t for you. Weekly options, with their faster time decay, can be particularly tricky. You need to consider how much you’re willing to lose on any single trade and overall. A good rule of thumb is to never risk more than 1-2% of your capital on a single trade. This means if you have $10,000, you wouldn’t want to risk more than $100-$200 on any one trade. This protects your capital so you can keep trading.
Setting income goals is a balancing act. You want to aim high enough to make the effort worthwhile, but not so high that you’re forced into taking excessive risks. It’s about finding that sweet spot where ambition meets prudence.
Assessing Your Current Financial Situation
Before you even think about setting income targets, take a hard look at your overall financial picture. How much money can you really afford to put into trading? This isn’t just about the initial investment; it’s about having enough capital to manage trades, absorb small losses, and avoid needing to dip into this money for everyday expenses. Trading should be done with funds you don’t need in the short term. Also, consider your existing income streams and expenses. If you’re relying on trading income to pay bills, the pressure can lead to poor decisions. It’s best to treat weekly options income as a bonus or a way to grow your wealth, rather than a primary source of funds, especially when you’re starting out. Understanding your personal finances helps set realistic income targets that won’t put you in a bind. You can explore different options strategies to see which ones fit your capital and risk profile, like using covered calls for consistent premiums or other income-focused approaches.
Choosing The Right Markets For Income
Alright, so you’re looking to make some regular cash with options. That’s cool. But not every stock or ETF is going to be your golden ticket. You gotta pick the right playground, you know? Think about it like fishing – you wouldn’t cast your line in a dried-up pond, right? You want a spot with plenty of fish. For options income, that means looking at markets that are active and have predictable movements, at least for the strategies we’re talking about.
High-Liquidity ETFs and Indices
When you’re aiming for weekly income, you need things to move, but not wildly. That’s where highly liquid Exchange Traded Funds (ETFs) and major stock market indices come in. These are the big players, like the S&P 500 (SPY) or the Nasdaq 100 (QQQ). Because so many people are trading options on them, the bid-ask spreads are usually tight, meaning you can get in and out without losing too much on the transaction costs. Plus, their movements are generally less erratic than a single, small-cap stock. This makes them a good fit for strategies like covered calls or credit spreads where you’re trying to collect premiums consistently. Focusing on these liquid markets helps ensure you can execute trades efficiently and manage your risk better. It’s all about making sure you can actually trade the options you want to trade without a hitch. You can find more info on how options work for income generation here.
Blue-Chip Stocks With Options
Beyond ETFs and indices, think about the big, well-established companies. We’re talking about the household names, the blue-chip stocks. These companies usually have a long history, stable earnings, and their stock prices tend to be less volatile than smaller companies. When you sell options on these stocks, you’re often dealing with a more predictable environment. For instance, selling a covered call on a company like Apple or Microsoft might not give you massive payouts, but it can provide a steady stream of income week after week, especially if you’re rolling your trades. The key here is that these stocks have options available with good volume, so you’re not stuck with illiquid contracts. It’s a solid choice if you prefer to have your capital tied up in companies you believe in long-term, while still generating some extra cash flow.
Sector-Specific Opportunities
Sometimes, you can find really good income opportunities by looking at specific sectors. Maybe there’s a particular industry that’s showing steady growth or is expected to stay relatively flat for a while. For example, if you’re looking at the utility sector, prices often don’t swing wildly. This can be perfect for certain income strategies. Or perhaps there’s a tech sector that’s experiencing a bit of a lull but is expected to rebound. Identifying these trends can help you pick the right underlying assets. It requires a bit more research, sure, but finding a sector that’s in a good spot for your chosen strategy can really pay off. You’re essentially looking for markets that fit the profile of the income strategy you want to use, rather than trying to force a strategy onto a market that doesn’t suit it.
Choosing the right market is like picking the right tool for the job. You wouldn’t use a hammer to screw in a lightbulb, right? Similarly, you need to match your options income strategy to the characteristics of the underlying asset. High liquidity, predictable price action, and available options volume are your best friends when you’re aiming for consistent weekly income.
Implementing Proven Income Strategies

Covered Calls For Consistent Premiums
This is a pretty straightforward strategy, honestly. You own shares of a stock, and you sell call options against those shares. Think of it like renting out a room in your house – you get paid for it, but you still own the house. The premium you collect upfront is your income. The goal here is to have the option expire worthless, so you keep the premium and your shares. It works best when you don’t expect the stock price to shoot up dramatically before the option expires. You’re essentially capping your upside potential in exchange for that immediate cash. It’s a good way to add a little extra income to your existing stock holdings.
Iron Condors In Sideways Markets
An iron condor is a bit more complex, involving four different options contracts. It’s a strategy that profits when the underlying asset stays within a specific price range. Basically, you’re selling options on both the call and put sides, and then buying further out-of-the-money options to limit your risk. It’s like setting up a fence on both sides of the stock’s price movement. This strategy is great when you think a stock is going to trade sideways, without big moves in either direction. The income comes from the premiums you collect from selling the options. It’s a neutral strategy, meaning it doesn’t rely on the stock going up or down, just staying put.
Credit Spreads For Directional Plays
Credit spreads are a bit different because they have a directional bias. You’re selling an option and simultaneously buying another option with the same expiration date but a different strike price. For example, with a bull put credit spread, you sell a put option and buy a further out-of-the-money put option. You collect a net premium. This strategy profits if the underlying asset moves in your favor or stays neutral, but not too far against you. It’s a way to generate income with a defined risk, where you’re betting on a certain price movement or lack thereof. The amount you can make is limited to the net premium received, but so is your potential loss.
Here’s a quick look at how these strategies generally stack up:
| Strategy | Primary Goal | Market Outlook | Risk Level | Income Potential | Complexity |
|---|---|---|---|---|---|
| Covered Call | Premium Collection | Neutral/Slightly Bullish | Low | Moderate | Low |
| Iron Condor | Sideways Price Range | Neutral | Moderate | Moderate | High |
| Credit Spread | Directional Bias | Bullish/Bearish | Moderate | Moderate | Medium |
Remember, no strategy is a magic bullet. Each has its own set of rules and potential pitfalls. It’s about picking the one that fits your view of the market and how much risk you’re comfortable taking on. Don’t jump in without understanding the mechanics.
Mastering Technical Analysis For Entries
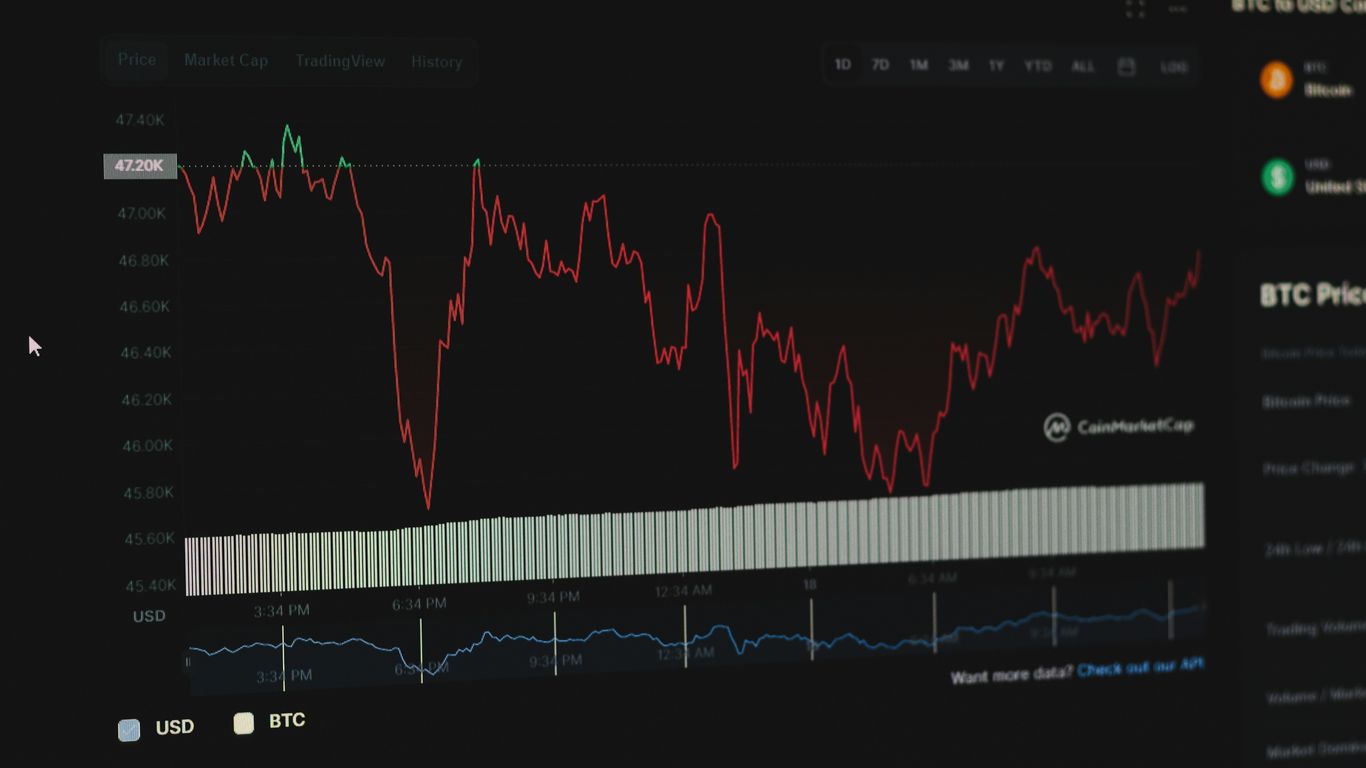
Okay, so you’ve got your strategy, you know your goals, but when do you actually jump into a trade? That’s where technical analysis comes in. It’s not about predicting the future with a crystal ball, but more about reading the signs the market is giving you right now. Think of it like checking the weather before a hike – you want to know if it’s clear skies or stormy seas ahead.
Key Indicators For Weekly Options
There are a bunch of tools out there, but for weekly options, we want things that react relatively quickly. Stuff like Moving Averages can show you the general direction prices have been heading. A crossover between, say, a 9-day Exponential Moving Average (EMA) and a 20-day Simple Moving Average (SMA) can signal a shift. Then there’s the Relative Strength Index (RSI), which helps you see if a stock is maybe getting a bit too expensive (overbought) or too cheap (oversold) in the short term. We usually look at the 70 and 30 levels for that. The MACD (Moving Average Convergence Divergence) is another good one for spotting changes in momentum. And don’t forget Bollinger Bands – they can show you when prices are moving a lot or not much, which is super helpful for picking entry points.
Here’s a quick look at how some indicators can work together:
| Primary Indicator | Secondary Indicator | Signal Strength |
|---|---|---|
| MACD | RSI | 85% |
| Moving Averages | Volume | 78% |
| Bollinger Bands | RSI | 82% |
Recognizing Profitable Chart Patterns
Charts tell stories, and patterns are like recurring plot points. For weekly options, we’re often looking for patterns that suggest a move is about to happen soon. Think about things like Flag Patterns, which often show up after a quick price jump and suggest the move might continue. Triangle patterns are also interesting because they show prices getting squeezed together, usually before a breakout. Double Tops can signal a potential reversal after a price has tried to go higher a couple of times. These patterns can give you a heads-up about potential opportunities.
Some common patterns and their typical timeframes:
- Double Tops: Often resolve within 3-5 trading days.
- Flag Patterns: Usually play out in 1-3 trading days.
- Triangles: Tend to break out within 2-4 trading days.
When you’re looking at chart patterns for weekly options, remember that they are not guarantees. They are probabilities. The faster timeframe of weekly options means these patterns might form and resolve more quickly than you’re used to. Always confirm with other indicators and manage your risk.
Volume And Price Action Signals
Indicators and patterns are great, but sometimes the simplest signals are the most direct. Price action is just what the price is doing. Is it making higher highs and higher lows? That’s usually bullish. Is it struggling to get past a certain price level? That could be resistance. Volume is like the energy behind the price move. A big price move on low volume might not be as reliable as a similar move on high volume. High volume often means more people are agreeing with the price direction. For example, if you see a stock break through a resistance level on a surge of volume, that’s a pretty strong signal that the move might continue. It’s about seeing the price and the trading activity line up. You can get a good sense of potential moves by looking at highly liquid ETFs and indices because their price action and volume are usually very clear.
Essential Risk Management Practices
Alright, let’s talk about the nitty-gritty of keeping your money safe when you’re trading options weekly. It’s easy to get excited about potential profits, but honestly, the most important thing is not losing what you have. Think of it like this: you wouldn’t go on a long road trip without checking your tires and brakes, right? Trading is no different.
Position Sizing For Capital Preservation
This is huge. You absolutely have to decide beforehand how much of your total trading money you’re willing to put on the line for any single trade. A common rule of thumb is to keep it small, maybe 1% to 5% of your account on any one trade. This way, if a trade goes south, it doesn’t wipe you out. It’s about staying in the game.
Here’s a quick look at how that might shake out:
- $25,000 Account: Risk $500 – $1,250 per trade.
- $50,000 Account: Risk $1,000 – $2,500 per trade.
- $100,000 Account: Risk $2,000 – $5,000 per trade.
It’s not just about the dollar amount, though. You also need to think about the number of contracts. If you have a $50,000 account and decide to risk $1,000, that might mean trading 2-5 contracts, depending on the option’s price. The goal is to limit how much you can lose on any single trade, no matter what happens.
Setting Stop-Losses And Exit Points
So, you’ve got your position size figured out. Now, what happens if the trade starts moving against you? That’s where stop-losses come in. These are pre-set instructions to sell your position if it hits a certain loss level. It takes the emotion out of it. You don’t have to sit there and watch the red numbers pile up, hoping it will turn around. Having a clear exit strategy before you even get into a trade is non-negotiable.
Think about where the price might find support or resistance. That’s often a good place to set your stop. For options, you might also set a stop based on a percentage of the premium you paid, maybe 25% to 50%. And if you’re trading options that expire very soon, like in a day or two, you might even use a time-based stop – if it hasn’t moved in your favor by a certain time, you get out.
The speed of weekly options trading means you need to be decisive. Don’t let a losing trade turn into a disaster because you were too slow to react. Your stop-loss is your safety net.
Understanding Time Decay Impact
This is something unique to options, and it’s called theta. Basically, as an option gets closer to its expiration date, its value erodes, especially if the underlying asset isn’t moving much. For strategies like selling options (think covered calls [4d48]), time decay can be your friend, as it works in your favor. But if you’re buying options, time decay is working against you, eating away at your potential profits.
Knowing how theta affects your specific trade is super important. It helps you set realistic profit targets and understand when you might need to adjust or exit a position, even if the price hasn’t moved dramatically. It’s another piece of the puzzle that helps you manage risk and protect your capital.
Optimizing Your Weekly Trading Schedule
So, you’ve got your income goals, you’ve picked your markets, and you’ve got a strategy ready to go. That’s awesome. But when exactly should you be placing those trades? Timing can make a surprisingly big difference, especially with weekly options where time decay is a major player. It’s not just about what you trade, but when.
Identifying Optimal Entry Times
When you’re looking to get into a weekly options trade, think about when the market is most active and when key information might be released. For many traders, the first hour after the market opens can be pretty wild. Prices are still settling from overnight news, and there’s a lot of initial activity. Some folks like this, others find it too choppy. A lot of people find that the period between 10:00 AM and 11:30 AM EST offers a good balance of liquidity and less initial frenzy. It gives you a chance to see how the day is shaping up.
Another common time to consider is right before a major economic announcement or earnings report. If you’re trading around these events, you’ll want to be positioned beforehand. For instance, if a big inflation report is due at 8:30 AM EST, you might want to have your trade set up by 8:00 AM. This allows you to capture any immediate reaction without getting caught in the initial surge or drop. The key is to align your entry with your strategy’s needs and the expected market behavior.
Here’s a quick look at typical market activity:
| Time Period (EST) | Market Activity Level | Notes |
|---|---|---|
| 9:30 AM – 10:00 AM | High | Opening volatility, news reaction |
| 10:00 AM – 11:30 AM | Moderate to High | Settling prices, good liquidity |
| 11:30 AM – 2:00 PM | Moderate | Mid-day consolidation, lower volume |
| 2:00 PM – 4:00 PM | Moderate to High | Afternoon push, potential reversals |
Managing Trades Through Expiration
As your weekly options get closer to expiration, things speed up. That time decay, or theta, really starts to bite. If you sold options, this is when you want to see the price stay put or move in your favor. If you bought options, you’re hoping for a big, quick move. It’s important to have a plan for these final days. Are you going to let the option expire worthless if you sold it? Or will you close it early to lock in a portion of the profit? For buyers, when do you take profits, and when do you cut losses?
Managing trades as expiration approaches requires a clear head. The temptation to make impulsive decisions is high. Stick to your pre-defined exit rules, whether that’s a profit target or a stop-loss. Remember, the goal is consistent income, not hitting home runs every single trade. Protecting your capital is paramount, especially in the final hours.
For example, if you sold a call option and the underlying stock price is rapidly approaching your short strike, you might consider closing the position early. This could be to avoid the risk of being assigned or to secure a good portion of the premium you collected. On the flip side, if you bought a call and the stock is making a strong move towards your target, you might hold on a bit longer, but always with an eye on your exit strategy. It’s about being proactive, not reactive.
Reviewing Performance For Adjustments
Trading isn’t a set-it-and-forget-it kind of deal, especially with weekly options. You absolutely need to look back at what you did and how it turned out. Did your trades hit your profit targets? Did they get stopped out? Why? Was it bad luck, or was there something you missed in your analysis? This review process is where you really learn and improve. It helps you refine your strategy and your timing. Maybe you notice that trades entered on Mondays tend to perform better for your covered calls, or that your credit spreads work best when initiated mid-week. Looking at your trading journal is key here. It’s not about beating yourself up over losses, but about gathering data to make better decisions going forward. This continuous feedback loop is what separates traders who just dabble from those who build a consistent income stream. You can find resources on building a trading watchlist to help with stock selection [bd5a].
Here are some questions to ask yourself during your review:
- Did I follow my trading plan for each trade?
- What was the primary reason for entering each trade?
- Did the market conditions align with my chosen strategy?
- Were my entry and exit points executed as planned?
- What could I have done differently to improve the outcome?
- How did time decay impact my positions, both positively and negatively?
Making your trading week work for you is key to success. Think about when you’re most focused and energetic – that’s prime time for making smart moves in the market. Planning your trading sessions can help you avoid mistakes and make the most of your opportunities. Ready to build a schedule that fits your life and boosts your trading game? Visit our website to learn how to create your perfect trading plan.
Wrapping It Up
So, we’ve gone over a bunch of ways to set up weekly options income goals that actually make sense. It’s not about hitting home runs every single time, but more about building a solid plan and sticking to it. Remember, the market moves fast, and things can change quickly. That’s why having clear goals, knowing your strategies inside and out, and always keeping an eye on risk management is super important. Don’t get discouraged if things don’t go perfectly at first. Keep learning, keep practicing, and adjust your approach as you go. You’ve got this.
Frequently Asked Questions
What exactly are weekly options, and how are they different from monthly ones?
Think of weekly options as short-term bets that expire every Friday. Unlike monthly options, which give you more time, weekly ones have a much shorter lifespan, usually just a few days. This means they cost less upfront but also lose their value faster. It’s like choosing between a quick sprint and a marathon – both have their own challenges and rewards.
How much money do I really need to start trading weekly options?
While there’s no strict rule, it’s a good idea to have at least a few thousand dollars, maybe $5,000 to $10,000. This lets you spread your risk out so you’re not putting all your eggs in one basket. It helps you follow smart rules about how much to invest in each trade.
What are the best tools to help me figure out when to buy or sell weekly options?
Traders often use tools like moving averages, the RSI (which tells you if something is being bought or sold too much), MACD (to see how fast prices are changing), and Bollinger Bands (to measure how much prices are jumping around). These tools, along with watching how prices move on charts, can give you clues about what might happen next.
Which stocks or markets are the best for trading weekly options?
It’s usually best to trade options on things that are easy to buy and sell quickly, like big stock market indexes (think SPY or QQQ) or well-known big companies (like Apple or Microsoft). These have lots of trading activity, so it’s easier to get in and out of trades without losing money on the price difference.
How do I keep from losing too much money when trading weekly options?
The key is to be careful. Only risk a small part of your money on any single trade, maybe 2-5%. Always decide ahead of time where you’ll sell if things go wrong (that’s a stop-loss). Also, understand that options lose value over time, especially as they get close to expiring.
When is the best time to jump into a weekly options trade?
This depends on your plan. Some traders like to get in a bit before big news or company reports come out. Others prefer to trade when the market is moving in a clear direction. It’s important to watch for signs of big price moves and consider how much prices are already jumping around.