
So, you’re looking at options that expire weekly, and things are getting a bit wild with volatility? It’s a common situation, especially around big news events. When that uncertainty disappears, the price of options can take a nosedive, and that’s what people call a volatility crush on weekly expiration. It can really mess with your trades if you’re not ready for it. But hey, it’s not all bad news. Smart traders can actually use this to their advantage. Let’s break down what’s happening and how you can handle it, or even make a profit from it.
Key Takeaways
- Understanding implied volatility (IV) is key; it’s the market’s guess about future price swings and directly impacts option prices. High IV means expensive options, low IV means cheaper ones.
- A volatility crush happens when implied volatility drops suddenly, often after an event like earnings. This makes options cheaper, potentially hurting buyers and helping sellers.
- For weekly options, the timing around an event is super important. Options expiring soonest after an event get hit hardest by the IV crush because there’s less time for new volatility to build.
- Strategies like selling straddles, iron condors, calendar spreads, and butterfly spreads can be used to potentially profit from this drop in volatility, but they all come with their own risks.
- Managing risk is a big deal. Using defined risk strategies, sizing your positions correctly, and always checking the potential reward versus the risk are vital steps to protect your money when dealing with a volatility crush on weekly expiration.
Understanding the Volatility Crush on Weekly Expiration
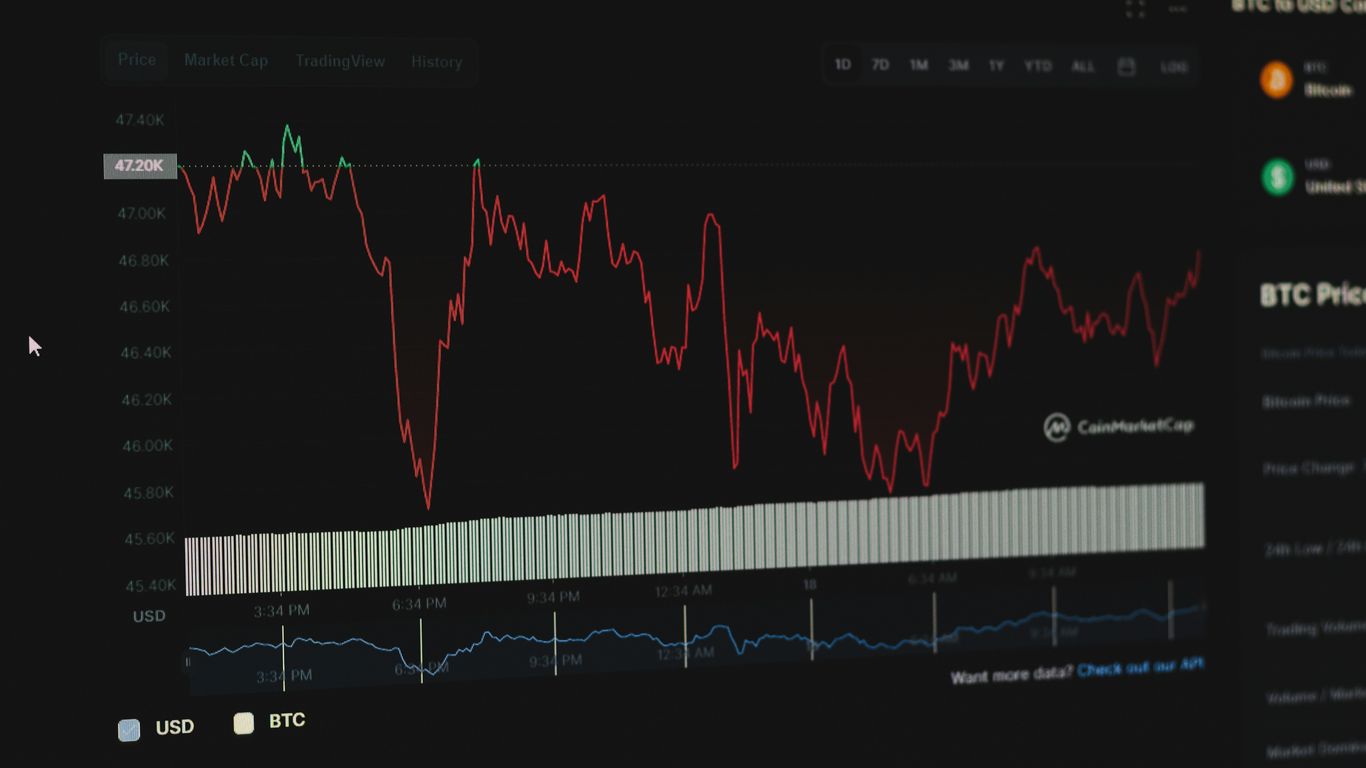
So, you’re trading options, especially those weekly ones, and you’ve probably heard the term "volatility crush." It sounds a bit dramatic, right? But it’s a real thing, and understanding it is pretty important if you don’t want your trades to go sideways unexpectedly. Basically, it’s all about how the market’s expectation of future price swings, called implied volatility (IV), can change really fast, especially around certain events.
Defining Implied Volatility and Its Impact
Implied volatility is like the market’s crystal ball for how much a stock or index is expected to move. When IV is high, it means traders are anticipating big price swings, and this makes options more expensive. Think of it like buying insurance – the more risk you expect, the more you’ll pay. Conversely, low IV means the market expects things to be pretty calm, so options are cheaper. This is a big deal because IV is a major factor in how options are priced. If you’re buying options, you want IV to go up or stay high. If you’re selling them, you generally want it to go down.
What Constitutes an Implied Volatility Crush?
An implied volatility crush, or IV crush, is when that expected future volatility suddenly drops off a cliff. It’s not just a small dip; it’s a rapid and significant decline. This usually happens after a specific event has passed, like an earnings announcement or a major news release. The uncertainty that drove up IV before the event is gone, so the market reprices the options lower. Imagine a stock’s IV was sky-high because everyone was waiting for earnings. Once the report is out, whether it’s good or bad, that uncertainty is resolved. The IV then plummets, and with it, the price of the options, especially those that were expensive due to that high IV.
Key Triggers for Volatility Contraction
What makes this IV crush happen? Several things can trigger it, but the most common ones are:
- Earnings Announcements: This is the big one. Before a company reports earnings, there’s a lot of guesswork about the results. This anticipation inflates IV. After the report, the uncertainty is gone, leading to a sharp drop.
- Economic Data Releases: Major economic reports, like inflation numbers or employment figures, can cause similar spikes and subsequent drops in IV for related assets.
- Major News Events: Think significant political developments, legislative votes, or geopolitical events. When the outcome is uncertain, IV rises. Once the event passes, IV often contracts.
- Expiration of Options: As options get closer to expiration, their IV naturally tends to decrease, especially if there’s no major event looming. This is sometimes called "time decay" but is closely related to the IV crush phenomenon.
It’s important to remember that an IV crush isn’t necessarily tied to whether the news was good or bad. The key factor is the resolution of uncertainty. Even a positive earnings surprise can lead to an IV crush because the market no longer has to guess what might happen.
Navigating Expiration Dates During Volatility Shifts
When you’re trading options, especially around big events that might cause a volatility crush, the expiration date of your contracts matters a lot. It’s not just a number; it really changes how these events affect your trades.
Impact of Proximity to Event Dates
Options that expire before a major event, like an earnings report or a big news announcement, usually aren’t going to be dramatically impacted by the volatility crush itself. Why? Because the implied volatility (IV) already reflects the known information. The big price swings are either expected or have already happened. It’s the options expiring closest to the event that feel the biggest punch of the IV crush. There’s new information, and not much time left for the market to digest it or for the option’s price to adjust naturally. This makes them super sensitive to that post-event IV drop.
Diminishing Effects of IV Crush Over Time
As you move further away from the event date, the impact of the IV crush starts to fade. Think of it like ripples in a pond; the initial splash is big, but the effect gets smaller the further out you go. So, options that have more time until they expire will see the IV crush effect lessen gradually. This is because there’s more time for other factors to influence the option’s price, and potentially, another event could happen within that timeframe, resetting the volatility cycle.
Options Maturing Beyond Three Months
Generally, options with more than three months left until expiration are pretty much unaffected by a specific IV crush event. This is mainly because there’s a good chance another significant event, like the next earnings cycle, will occur before these longer-dated options expire. This means the IV for these options is more likely to be influenced by future expectations rather than the immediate aftermath of a single past event. It’s like looking at a long road trip versus a short drive; the factors affecting the journey are different. For traders looking to avoid the direct impact of an IV crush, focusing on longer-dated options can be a way to manage risk.
Understanding how expiration dates interact with volatility shifts is key. It helps you pick the right options to trade, avoiding the worst of the crush or even positioning yourself to benefit from it, depending on your strategy.
Strategic Approaches to Profit from Volatility Contraction
So, you’ve got this idea that implied volatility is going to drop after some big event, like earnings. That’s the ‘volatility crush’ we’ve been talking about. The trick is to set up trades that actually make money when that happens, without you losing your shirt. It’s not as complicated as it sounds, but you do need a plan.
Selling Straddles and Iron Condors
Selling options is often the go-to when you expect volatility to fall. Think about selling a straddle – that’s selling both a call and a put at the same strike price. If the stock doesn’t move much and volatility drops, you can profit. An iron condor is similar but involves selling both a call spread and a put spread. It’s a bit more defined in terms of risk. The goal here is to collect premium from selling options that are overpriced due to high implied volatility.
Here’s a quick look at how these might play out:
| Strategy | Max Profit | Max Loss | Breakeven Points |
|---|---|---|---|
| Short Straddle | Premium Collected | Unlimited (if stock moves significantly) | Strike Price +/- Premium Collected |
| Iron Condor | Net Premium Rec’d | Defined (difference in strikes minus premium) | Lower Put Strike – Premium; Upper Call Strike + Premium |
When selling options, especially naked ones, you’re essentially betting that the implied volatility will decrease and the underlying asset won’t make a huge move. It’s a way to profit from time decay and a shrinking volatility premium.
Implementing Calendar Spreads
Calendar spreads are interesting because they play on time and volatility. You sell a shorter-term option and buy a longer-term option, usually with the same strike price. When an event like earnings happens, the short-term option’s implied volatility often gets crushed faster than the longer-term one. This can lead to a profit if the price stays near the strike. It’s a way to benefit from the time decay of the front-month option while the longer-dated option is less affected initially. You can find some good opportunities by looking at implied volatility levels for different stocks.
Leveraging Butterfly Spreads
Butterflies are a bit more complex but can be really effective. You’re essentially setting up a trade with limited risk and limited profit potential, betting that the stock price will stay within a certain range. You buy one option, sell two options at a different strike, and buy one more option at yet another strike. If implied volatility drops and the stock stays put, the options you sold lose value faster than the ones you bought. This strategy is great because even if you’re wrong about the exact price, as long as the stock doesn’t move too wildly, your losses are capped. It’s a good way to play a volatility crush without taking on massive risk.
Essential Risk Management for Volatility Crush Trades
Okay, so we’ve talked about how implied volatility can drop, sometimes pretty fast, especially around big events like earnings. It sounds like a good time to sell options, right? But hold on a second, because if you don’t manage your risk properly, this whole volatility crush thing can really bite you. It’s not just about picking the right strategy; it’s about making sure you don’t lose your shirt if things go sideways.
Defining Risk-Defined Strategies
This is probably the most important part. A risk-defined strategy means you know exactly how much you could lose before you even put the trade on. You’re setting a limit. Think of it like putting up safety nets before you start climbing. For example, instead of just selling a naked put, you might sell a put and buy another one further out of the money. This way, if the stock tanks way more than you expected, your losses are capped. It’s about being in control, not just hoping for the best. We want to make sure that even if the market throws a curveball, our account stays in one piece. It’s about playing the long game, not just trying to hit a home run on one trade. This approach helps you mitigate risks associated with this often-feared aspect of options trading.
The Importance of Proper Position Sizing
Even with a great strategy, if you bet too much on one trade, you’re asking for trouble. Position sizing is all about figuring out how many contracts you should trade based on your total account size and how much risk you’re comfortable with. A common rule of thumb is to risk only a small percentage of your capital on any single trade, maybe 1-2%. So, if you have a $10,000 account, you might only risk $100-$200 on a particular trade. This means that even if you get a few trades wrong in a row, you won’t wipe yourself out. It’s like spreading your bets instead of putting all your money on one horse.
Here’s a simple way to think about it:
- Calculate your total trading capital. This is the money you’ve set aside specifically for trading.
- Determine your maximum risk per trade. A common starting point is 1% to 2% of your total capital.
- Figure out the cost of your trade. This is usually the maximum potential loss for your chosen strategy.
- Divide your maximum risk by the cost per trade to find out how many contracts you can trade.
For instance, if you have a $20,000 account and decide to risk 1% ($200) on a trade where the maximum loss per contract is $50, you’d trade $200 / $50 = 4 contracts.
Evaluating the Risk-Reward Ratio
Before you even enter a trade, you need to look at the potential reward versus the potential risk. What’s the most you could make, and what’s the most you could lose? You want to see a situation where the potential profit is significantly larger than the potential loss. A ratio of 2:1 or 3:1 (reward to risk) is often considered good. If a trade has a potential profit of $100 but a potential loss of $200, that’s a 1:2 ratio, and you’d probably want to pass on it. It’s about making sure that if you’re right, you make enough to make the risk worthwhile, and if you’re wrong, the loss isn’t catastrophic.
It’s easy to get excited about the potential profits when implied volatility is high, but you absolutely must temper that excitement with a clear-eyed view of the downside. Without a solid plan for managing risk, even the most theoretically sound strategy can turn into a losing proposition when volatility crushes.
Utilizing Tools for Volatility Crush Analysis
So, you’re trying to get a handle on this whole volatility crush thing, right? It can feel like trying to catch smoke sometimes, but thankfully, there are some tools out there that can make it a bit less mysterious. Think of them as your trusty sidekicks in the options trading jungle.
Leveraging Option Screeners Effectively
Option screeners are pretty neat. They let you sift through tons of data to find specific situations. For volatility crush, you’ll want a screener that can show you implied volatility (IV) levels, how they’ve been moving, and maybe even how they stack up against historical data. Being able to quickly identify stocks with high IV that are also approaching a known event, like earnings, is a big help. It saves you from manually checking every single stock out there.
Analyzing Implied Volatility Rank and Percentile
This is where things get a bit more specific. Implied Volatility Rank (IVR) and Implied Volatility Percentile (IVP) are super useful metrics. IVR tells you where the current IV sits compared to its high and low over a specific period, usually a year. IVP does something similar but tells you what percentage of that period the IV has been below the current level. So, if a stock has an IVP of 90%, it means its IV has been lower than it is now for 90% of the time over the past year. This is a strong signal that IV might be high and could potentially drop – prime territory for a volatility crush.
Here’s a quick look at what these might mean:
| Metric | High Value Suggests | Low Value Suggests |
|---|---|---|
| IV Rank | IV is near its yearly high | IV is near its yearly low |
| IV Percentile | IV has been higher more often than not | IV has been lower more often than not |
Interpreting Historical Volatility Data
Looking at historical volatility (HV) alongside implied volatility is also smart. HV is what the stock actually did, while IV is what the market thinks it will do. When IV is much higher than HV, it often means the market is pricing in a big move that might not happen. After an event, if the actual move was less than what IV suggested, you’ll often see IV drop sharply to align more closely with HV. Watching these two metrics together can give you a clearer picture of whether a volatility crush is likely or already happening.
You’re essentially trying to spot situations where the market’s expectation of future movement (IV) is out of sync with what’s actually happening or likely to happen. When that gap closes, that’s your volatility crush.
So, using these tools helps you move from just guessing to making more informed decisions about when and where a volatility crush might occur. It’s about finding those opportunities where the market might be overpricing future uncertainty.
Case Studies of Volatility Crush Scenarios

Let’s look at some real-world examples to see how this volatility crush thing plays out. It’s not just theoretical; it happens all the time.
Post-Earnings Volatility Contraction
This is probably the most common place you’ll see an implied volatility crush. Think about a company like Apple or Nvidia. Before they announce their earnings, everyone’s a bit unsure about what the numbers will be. This uncertainty makes options more expensive because their implied volatility (IV) goes up. Then, bam! The earnings report comes out. Even if the stock price moves a little, the uncertainty is gone. That sudden drop in uncertainty causes the IV to fall, sometimes dramatically. This is what we call an earnings-driven volatility spike.
For instance, imagine you bought a call option on a stock before earnings, expecting a big price jump. The stock does move up, but if the IV drops more than the stock price increases, your option might not make as much money as you thought, or it could even lose value. It’s a classic situation where the market prices in a lot of potential movement before the event, and then reality is less dramatic.
Here’s a simplified look at what can happen:
| Scenario | Stock Price | Implied Volatility | Option Price |
|---|---|---|---|
| Before Earnings | $100 | 25.9% | $5.00 |
| After Earnings | $107 | 15.3% | $4.50 |
See? The stock went up, but the option price went down because the IV fell so much.
Impact of Legislative Events on Volatility
Major government announcements or new laws can also cause a big swing in implied volatility. When a new bill is being debated, especially one that could significantly impact an industry, you’ll often see IVs rise for companies in that sector. Traders are trying to price in the potential outcomes.
Once the legislation is passed, or a decision is made, the uncertainty is removed. This leads to a volatility crush. The options that were expensive due to the anticipation of the event become cheaper.
Consider these points:
- Event Uncertainty: High IV reflects the market’s guess about future price swings related to the event.
- Resolution: When the event concludes, the market has a clearer picture, reducing the need for high IV.
- Impact on Options: Options sellers can benefit from this crush, while option buyers might see their gains shrink if they didn’t account for the IV drop.
It’s important to remember that the direction of the stock price after the event doesn’t always dictate the option’s profitability. The change in implied volatility can be a much bigger factor, especially for options that expire soon.
Analyzing Option Price Behavior
Looking at how option prices behave around these events is key. You can track the implied volatility of options for a specific stock or index. When you see that IV spike before an event and then plummet afterward, that’s your visual cue for a volatility crush.
For example, if you’re watching options on a biotech company awaiting FDA approval for a drug, you’ll likely see IV skyrocket as the decision date nears. If the approval is granted, the IV will likely fall sharply. Conversely, if it’s denied, the IV might also fall, but perhaps less dramatically, as the uncertainty about that specific outcome is resolved, even if it’s negative news. The key takeaway is that the resolution of uncertainty is the primary driver of the crush, regardless of whether the news was good or bad.
Ever wondered how options trading can go wrong? Our "Case Studies of Volatility Crush Scenarios" section dives into real-life examples of when things didn’t go as planned. We break down what happened, why it happened, and most importantly, how you can avoid similar pitfalls. Understanding these tough situations is key to becoming a smarter trader. Want to learn more about navigating the ups and downs of the market? Visit our website today to explore these case studies and discover strategies for success!
Wrapping Up: Trading Through the Volatility Crush
So, we’ve talked a lot about this ‘volatility crush’ thing, especially around big events like earnings. It’s basically when the market’s guess about future price swings drops off a cliff, and that can really mess with option prices. We looked at how expiration dates matter a ton – options close to the event get hit hardest. Remember, understanding when these crushes happen and having a solid plan is key. Using strategies like selling options or spreads, and always keeping an eye on your risk, can help you not just survive but maybe even make a little something from these wild swings. It’s not easy, but with the right approach, you can handle it.
Frequently Asked Questions
What exactly is implied volatility, and why does it matter for options traders?
Implied volatility, or IV, is like a crystal ball for the stock market. It shows how much traders expect a stock’s price to move up or down in the future. When IV is high, it means people are betting on big price swings, making options more expensive. If IV is low, folks expect smaller moves, so options are cheaper. Knowing the IV helps you figure out if an option’s price is fair.
Can you explain what an ‘implied volatility crush’ is in simple terms?
An implied volatility crush, or IV crush, happens when the expected future price swings (the IV) suddenly drop. Think of it like this: before a big event, like a company’s earnings report, people are nervous and expect big moves, so IV goes up, making options pricey. But once the event happens and the news is out, that nervousness disappears, and IV crashes down, making options cheaper, often very quickly.
What usually causes this ‘volatility crush’ to happen?
The most common cause for an IV crush is a major event, like a company announcing its earnings. Before the announcement, there’s a lot of guessing about what the news will be, which makes IV spike. After the news is released, the uncertainty is gone, and IV falls back to normal levels. Other events, like big government decisions or news that affects a whole industry, can also trigger an IV crush.
How do the dates when options expire affect an IV crush?
Expiration dates are super important. Options that expire very soon after a big event will feel the IV crush the most because there’s not much time left for the stock price to move around. Options that expire way out in the future, like more than three months away, usually aren’t affected much because other events could happen before they expire. Options expiring before the event usually aren’t impacted much either, as the IV already reflects the known information.
What are some ways traders try to make money when volatility drops?
Some traders actually try to profit from an IV crush. For example, they might sell options (like straddles or iron condors) before the event. If IV crushes afterward, the options they sold become cheaper, and they can make money. Other strategies, like calendar spreads or butterfly spreads, can also be set up to benefit from this drop in volatility, often with limited risk.
What’s the most important thing to remember about managing risk during an IV crush?
The biggest thing is to be smart about how much you could lose. This means picking strategies where you know your maximum possible loss beforehand (risk-defined strategies). It’s also key to only risk a small part of your money on any single trade (proper position sizing). Always check if the potential profit is worth the risk you’re taking (risk-reward ratio). Doing these things helps protect your money, even when volatility makes big, sudden moves.