
Earnings season can be a wild ride for stocks. You hear about companies doing great or not so great, and that can really shake things up price-wise. Many people jump into options around this time, hoping to catch a big move. But, honestly, a lot of folks get it wrong and end up losing money. This guide is here to help you understand how to actually make smart moves with options, especially the weekly kind, when earnings reports are dropping. We’ll break down the strategies so you can be one of the informed traders.
Key Takeaways
- Weekly options, expiring every Friday, offer shorter trading windows and lower upfront costs than monthly options, but they also lose value faster due to time decay.
- Using tools like moving averages, RSI, and MACD, along with recognizing chart patterns, can help pinpoint potential price movements for weekly options trades.
- Popular strategies for weekly options during earnings include covered calls for income, iron condors for stable markets, and credit spreads for betting on price direction.
- Managing risk is super important; it’s smart to limit your trades to a small part of your capital and set limits on how much you’re willing to lose on each trade.
- High-volume stocks like those in major tech and financial sectors are often good places to look for weekly options activity due to their consistent trading.
Capitalizing on Earnings Season with Weekly Options
Earnings season. It’s that time of year when companies drop their latest financial reports, and the market can get pretty wild. For us traders, especially those who like to work with weekly options, this period can be a goldmine if you know what you’re doing. It’s all about riding those short-term price swings that often pop up right around these announcements.
Weekly options are perfect for this because they expire every Friday, meaning you can get in and out of trades much faster than with monthly options. This short timeframe is key when you’re trying to profit from the immediate reaction to an earnings report. Think of it like this: a company reports, the stock jumps or drops, and you want to capture that move before it fizzles out. That’s where weeklies shine.
Understanding the Earnings Event’s Impact on Stock Prices
When a company announces earnings, it’s a big deal. The results can tell us a lot about how the business is doing, and the market reacts. Sometimes, the stock price barely moves, especially if the results were exactly what everyone expected. Other times, it can swing dramatically, either up or down, based on whether the news was a surprise or if the company’s outlook changed. This volatility is what we’re after. It’s not just about the numbers themselves, but also what management says about the future. That forward-looking guidance can often move the stock more than the past quarter’s results.
Leveraging Weekly Options for Short-Term Volatility
Weekly options give us a way to bet on these short-term price movements. Because they expire so quickly, their prices can change a lot based on even small stock moves. If you think a stock is going to jump after earnings, you might buy call options. If you think it’s going to fall, you might buy put options. The trick is timing it right. You want to get in close to the earnings announcement but not so close that you’re caught in the chaos right before it. Many traders like to get into positions a few days before the report, hoping to catch the anticipation move, and then get out before the actual announcement to avoid the big drop in option prices that often happens afterward. This is sometimes called ‘volatility crush’, and it can really eat into your profits if you’re not careful. It’s important to manage your cash reserves, aiming for at least 50% in cash for flexibility and protection, as discussed in managing cash reserves.
Strategic Timing for Earnings-Driven Trades
Timing is everything with weekly options, especially around earnings. You can’t just buy an option and hope for the best. You need a plan. A common approach is to enter trades about three to five days before the earnings announcement. This gives the options time to potentially increase in value as the event approaches, but it also allows you to exit before the post-earnings volatility crush. You’ll want to look at stocks that have a history of making big moves during earnings. Checking the earnings announcement schedule is a must, and keeping an eye on implied volatility rankings can also help. If implied volatility is really high, it means the market expects a big move, which could mean higher option premiums. You might want to sell options in that case, or buy them if you think the market is underestimating the potential move. It’s a delicate balance, and understanding the expected move magnitude is key.
Key Strategies for Weekly Options During Earnings
Trading weekly options around earnings reports can be a bit like trying to catch lightning in a bottle. You’ve got this intense burst of activity, but it happens fast, and you need to be ready. The key is to pick strategies that make sense for that short, sharp volatility.
Covered Calls for Income Generation Around Earnings
This is a classic for a reason. If you already own the stock, selling a covered call can bring in some extra cash, especially when implied volatility is high before an earnings announcement. You’re essentially betting that the stock won’t jump too far past your strike price. It’s a way to get paid while you wait, but you do cap your upside if the stock really takes off. It’s a good way to generate income, but you have to be okay with potentially missing out on huge gains.
Iron Condors for Sideways Markets Pre-Earnings
An iron condor is a more complex strategy, involving selling both a call spread and a put spread. You use it when you think the stock price will stay within a certain range leading up to earnings. The idea is to collect premium from both sides, profiting if the stock doesn’t move much. However, with weekly options, that time frame is really tight. If the stock makes a big move in either direction, you can lose money. It’s a strategy for when you’re pretty sure earnings won’t cause a massive price swing, which isn’t always the case.
Credit Spreads for Directional Bets on Earnings Moves
If you have a strong feeling about which way a stock will move after earnings, a credit spread can be a good choice. You sell an option and buy another further out-of-the-money to limit your risk. For example, if you think a stock will go up, you might sell a put and buy a further out-of-the-money put. You collect a net credit. The profit is capped at the credit received, and the risk is also limited. It’s a way to make a directional bet with defined risk, which is important when dealing with the uncertainty of earnings. Getting the timing right is everything here; you want to enter a few days before the announcement to catch that elevated implied volatility, but exit before the actual report to avoid the volatility crush.
Here’s a quick look at how these might play out:
| Strategy | When to Use | Max Profit | Max Loss |
|---|---|---|---|
| Covered Call | Own stock, expect moderate price movement | Premium Received | Stock Depreciation |
| Iron Condor | Expect low volatility, stock in a range | Net Premium | Defined |
| Credit Spread | Expect directional move, defined risk needed | Net Credit | Defined |
Remember, with weekly options, time is always working against you. You need your trade to work out quickly, so picking the right strategy based on your market outlook and the stock’s behavior is super important. Don’t get caught holding an option that expires worthless just because you waited too long.
Technical Analysis for Earnings Option Plays
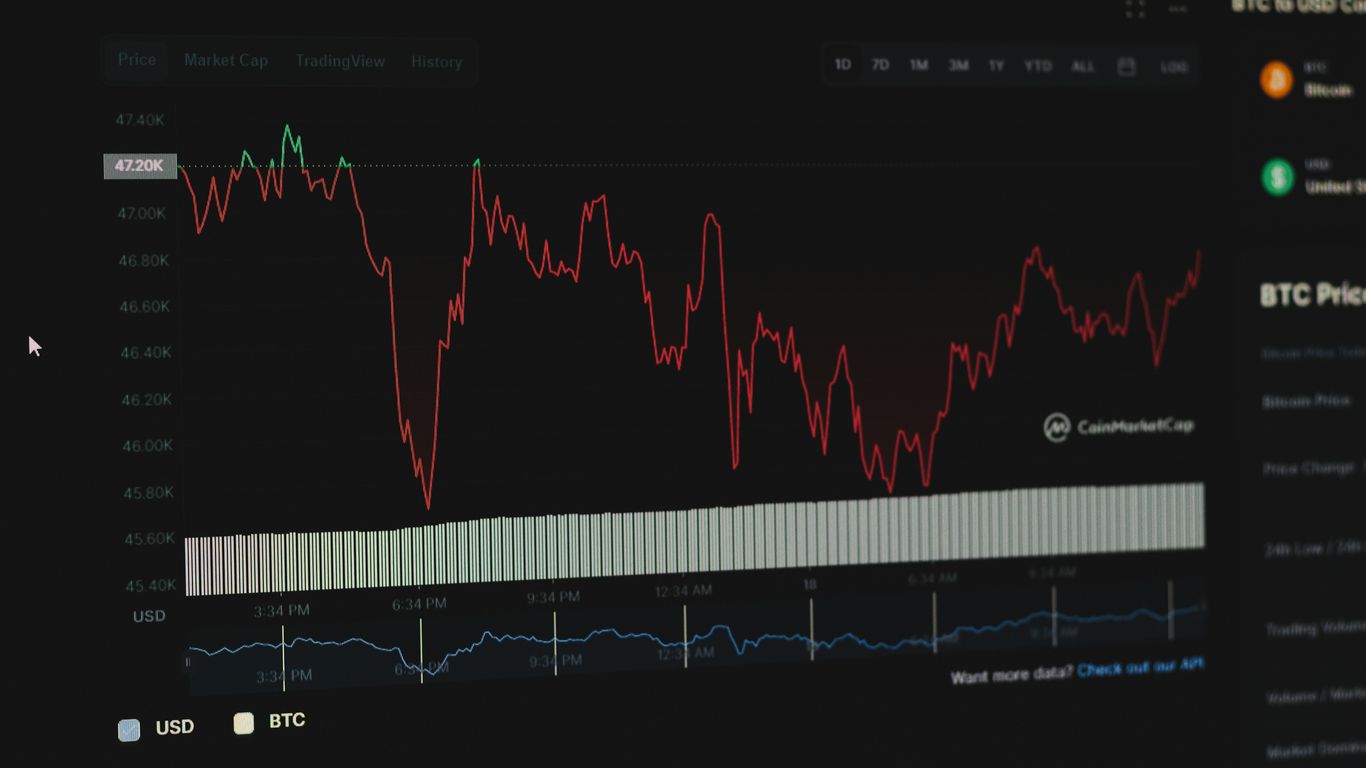
When you’re looking at trading options around earnings, technical analysis can really help you get a feel for what might happen. It’s not about predicting the future perfectly, but more about understanding patterns and signals that have worked before. Think of it like reading a weather report before a big game – you get a better idea of what conditions to expect.
Identifying Chart Patterns for Earnings Breakouts
Certain chart patterns can give you clues about potential price movements after an earnings announcement. These are visual representations of price action over time. For instance, patterns like flags or pennants often suggest a continuation of a prior trend, which could mean a stock might keep moving in the same direction after earnings if the trend was already strong. On the other hand, patterns like double tops or bottoms can signal a potential reversal. If you see one of these forming before earnings, it might suggest the stock could move against its recent trend after the announcement. Triangles, whether ascending, descending, or symmetrical, often indicate a period of consolidation before a significant price move, or a breakout. The key is to look for these patterns to form in the days leading up to the earnings report.
Here’s a quick look at some common patterns and their typical implications:
- Flag/Pennant: Often signals a continuation of the prior trend. Good for trades expecting a post-earnings move in the direction of the pre-earnings trend.
- Double Top/Bottom: Suggests a potential reversal. Could be useful if you anticipate a change in the stock’s direction after earnings.
- Triangle Patterns: Indicate consolidation and often precede a breakout. Useful for anticipating a sharp move, but the direction might be less clear until the breakout occurs.
Utilizing Moving Averages and MACD for Momentum
Moving averages are pretty straightforward tools. They smooth out price data to create a single flowing line, making it easier to see the trend. Common ones are the 9-day Exponential Moving Average (EMA) and the 20-day Simple Moving Average (SMA). When the shorter-term EMA crosses above the longer-term SMA, it’s often seen as a bullish signal, suggesting upward momentum. The opposite, the EMA crossing below the SMA, is typically bearish. The Moving Average Convergence Divergence (MACD) indicator is also popular. It uses moving averages to show changes in momentum. When the MACD line crosses above the signal line, it can indicate increasing bullish momentum, and when it crosses below, it suggests bearish momentum is building. These indicators can help you gauge the underlying strength or weakness in a stock before earnings, which can inform your options strategy. For example, if a stock is showing strong upward momentum on both indicators, you might lean towards bullish option plays.
Bollinger Bands and RSI for Volatility Signals
Bollinger Bands are great for spotting changes in volatility. They consist of a middle band (usually a 20-day SMA) and two outer bands set at a certain distance (standard deviation) above and below the middle band. When the outer bands squeeze closer together, it means volatility is low, often preceding a period of higher volatility – which is exactly what we look for around earnings. When the bands widen, it shows increased volatility. The Relative Strength Index (RSI) is another useful tool. It measures the speed and change of price movements. An RSI reading above 70 typically means a stock is overbought, and below 30 means it’s oversold. However, around earnings, these levels can be less reliable for predicting reversals because the event itself can cause significant price swings regardless of prior overbought or oversold conditions. Instead, look at how the RSI is behaving in relation to the price action and Bollinger Bands. A strong move that pushes the RSI into extreme territory, especially if it coincides with the bands widening, can signal a significant price move is underway. You might consider selling options with strikes far out-of-the-money if you expect the stock to stay within a certain range, or buying options if you anticipate a breakout beyond these bands. Understanding these tools can help you pick the right strike prices and expirations for your trades, potentially improving your chances of success with options strategies.
When analyzing stocks for earnings option plays, it’s important to remember that technical indicators are not crystal balls. They are tools to help you interpret market sentiment and potential price behavior. Combining insights from chart patterns, momentum indicators like MACD, and volatility indicators like Bollinger Bands can provide a more robust picture. Always consider the broader market context and the specific company’s news when making your decisions.
Managing Risk with Weekly Options During Earnings
Trading weekly options around earnings can feel like walking a tightrope. You’ve got the potential for big moves, but also the risk of losing your shirt if things go south fast. Because these options expire so quickly, managing your risk isn’t just a good idea; it’s pretty much the whole ballgame.
Setting Stop-Losses for Premium Protection
One of the most straightforward ways to keep yourself from getting wiped out is by using stop-loss orders. With weekly options, especially around earnings, prices can swing wildly. You don’t want a single bad trade to take out a huge chunk of your capital. A good rule of thumb is to set your stop-loss at about 25% to 50% of the premium you paid for the option. This means if the trade moves against you and the option loses that much value, you’re out, preserving the rest of your capital for the next opportunity. It’s a way to cut your losses before they become unmanageable.
Understanding and Managing Time Decay
Time decay, or theta, is the silent killer of option premiums. For weekly options, this decay happens much faster than with longer-term contracts. You can see this in how quickly the value of an out-of-the-money option can evaporate in the days leading up to expiration. If you’re holding an option that isn’t moving in your favor, time decay will work against you, eating away at its value. This is why timing your entry is so important. Getting into a trade too early, or holding onto a losing trade for too long, can mean that even if the stock makes a move, the time decay has already taken too much value out of your option.
With weekly options, the clock is always ticking louder. You have a much shorter window to be right about your directional bet or volatility play. If the market doesn’t move as you expect, or if it moves too slowly, the rapid time decay can turn a potentially profitable trade into a loser before the underlying stock even has a chance to catch up.
Avoiding Overtrading and Chasing Gamma
It’s easy to get caught up in the excitement of earnings season and start placing too many trades. This is called overtrading, and it usually leads to sloppy decisions and increased losses. Stick to your plan and only take trades that meet your specific criteria. Another pitfall is chasing gamma. Gamma measures how much an option’s delta changes as the underlying stock price moves. As an option gets closer to expiration and is at-the-money, its gamma increases. This means its delta can change very rapidly, leading to sudden, sharp price swings in the option itself. Trying to constantly adjust your positions to keep up with these gamma effects can be exhausting and costly. It’s often better to set your position and let it play out, rather than trying to micromanage it second-by-second, especially when dealing with the accelerated nature of weekly options. Focusing on high-volume stocks can help ensure you have enough liquidity for your trades, which is a key part of managing risk effectively. You can find good information on this by looking at major tech stocks for weekly option activity.
Selecting High-Volume Stocks for Earnings Trades
When you’re looking to trade options around earnings, picking the right stock is half the battle. You want stocks that have plenty of options activity, meaning lots of buyers and sellers. This usually means bigger companies, the ones everyone’s talking about. It makes it easier to get in and out of trades without the price moving too much against you. Plus, higher volume often means tighter bid-ask spreads, which saves you money on every trade.
Analyzing Major Tech Stocks for Weekly Option Activity
Big tech names are usually a good bet for consistent options volume. Think companies like Apple (AAPL), Microsoft (MSFT), and Amazon (AMZN). These giants report earnings regularly, and the options market around them is always buzzing. You’ll find a ton of weekly options available, giving you plenty of choices for timing your trades. Just remember, while the volume is high, these stocks can also make big moves, so you need to be prepared for that.
Financial Sector Securities for Consistent Action
The financial sector is another area that tends to have steady options trading, even outside of earnings season. Banks like JPMorgan (JPM) or Goldman Sachs (GS) often show predictable price patterns, which can be helpful if you’re looking at strategies like credit spreads. Even stocks like Bank of America (BAC) can offer lower-cost options, making them more accessible for smaller accounts. These stocks might not have the explosive moves of tech, but their consistency can be a real advantage for weekly options.
Volatility ETFs and Commodity Funds for Diverse Plays
If you want to add some variety, consider exchange-traded funds (ETFs) that track volatility or commodities. For instance, ETFs like VXX or UVXY are designed to move with volatility, and they have active weekly options markets. Trading options on these can be a way to bet on market swings. Similarly, commodity funds, like those tracking oil (USO) or gold (GLD), can offer opportunities, especially when there’s news affecting supply or demand. These can be a bit more complex, so make sure you understand what drives their prices before jumping in.
Here’s a quick look at some examples:
| Security | Avg Daily Volume | Typical Bid-Ask Spread |
|---|---|---|
| VXX | 325,000 | $0.08 |
| USO | 175,000 | $0.10 |
| GLD | 150,000+ | $0.12 |
When picking stocks for earnings trades, look for high open interest and volume in the weekly options. This tells you that other traders are actively participating, which is usually a good sign for liquidity. Also, check the historical price movement around earnings for the specific stock. Does it tend to move a lot, or does it stay relatively flat? This will help you choose the right strategy.
The Role of Implied Volatility in Earnings Options
Implied volatility, or IV, is a big deal when you’re looking at options, especially around earnings. Think of it as the market’s best guess about how much a stock’s price might swing in the future. When a company is about to report earnings, there’s a lot of uncertainty, right? Nobody knows for sure if they’ll beat expectations, miss them, or just do okay. This uncertainty makes the stock price potentially more volatile, and that expectation gets baked into the price of options. So, as earnings approach, IV usually goes up. This makes options premiums more expensive for everyone.
This increase in option prices before an earnings announcement presents a trading opportunity. It’s like the market is overestimating the potential price move, giving savvy traders a chance to sell options at a higher premium. When the earnings are finally announced, and the dust settles, that uncertainty often disappears. The market has new information, and the expected price swings usually shrink. This drop in implied volatility after an event is often called ‘volatility crush’. When IV crushes, option prices tend to fall, which can be good for those who sold options before the announcement.
Here’s a quick look at how IV can change:
- Pre-Earnings: IV typically rises as the earnings date gets closer.
- Post-Earnings: IV often drops sharply once the announcement is made and the market digests the news.
It’s important to remember that the ‘expected move’ derived from IV isn’t always what actually happens. Sometimes, the actual price movement is less than what the options market was pricing in. For instance, a stock might have an implied move of 5% based on IV, but historically, it only moves 3% after earnings. This difference between expected and actual movement is something to watch. Understanding this dynamic helps in choosing the right strategies, like selling options when IV is high before earnings, and being aware of the potential for volatility crush afterward. You can find tools that help analyze these expected moves, giving you a better picture of the market’s sentiment before the earnings announcement.
Monitoring IV rankings can give you a clue about whether options are relatively expensive or cheap compared to their historical levels. If IV is unusually high, it might suggest that the market is pricing in a big move, potentially creating an opportunity to sell premium. Conversely, if IV is low, it might mean the market expects a smaller move, which could be a signal to buy options if you anticipate a surprise.
Practical Application: A Weekly Options Earnings Example
Let’s walk through a hypothetical scenario to see how this all comes together. Imagine "TechGiant Inc." (TGI) is set to report earnings next Friday. The stock has been trading around $150, and analysts are expecting a moderate move, but the market’s been a bit jumpy lately.
Entry Rationale and Spread Selection
I’m feeling pretty good that TGI will move, but I’m not sure if it’ll be a huge jump or a slight dip. Given the uncertainty and the short timeframe before expiration, a credit spread seems like a solid choice. It lets me profit if the stock stays within a certain range or moves slightly in my favor, and it caps my potential loss. Specifically, I’m thinking about a bearish put credit spread. This means I’ll sell a put option at a higher strike price and buy another put option at a lower strike price, both expiring next Friday.
My reasoning is this: if TGI’s earnings are just okay, or even a little disappointing, the stock might dip slightly. I’m betting it won’t drop too much, certainly not below my lower strike price. By selling the higher strike put, I collect a premium. Buying the lower strike put acts as my protection, limiting my risk.
Here’s a potential setup:
- Sell 1 TGI $145 Put expiring next Friday for $1.50 premium.
- Buy 1 TGI $140 Put expiring next Friday for $0.75 premium.
This creates a net credit of $0.75 per share ($75 per contract), and my maximum risk is the difference between the strikes minus the credit received ($5.00 – $0.75 = $4.25 per share, or $425 per contract). The maximum profit is the credit received, $0.75.
Trade Execution and Target Outcomes
I’d place this order as a spread to ensure both legs are executed simultaneously. My goal is to have TGI close above $145 by expiration. If that happens, both puts expire worthless, and I keep the full $0.75 credit.
What if TGI drops, but stays above $140?
- If TGI closes at $142, the $145 put I sold might be worth around $3.00, and the $140 put I bought might be worth around $2.00. My net loss would be the difference ($1.00) minus the credit ($0.75), resulting in a $0.25 loss per share.
What if TGI drops below $140?
- If TGI closes at $138, the $145 put I sold would be worth about $7.00, and the $140 put I bought would be worth about $2.00. My loss would be the difference ($5.00) minus the credit ($0.75), hitting my maximum loss of $4.25 per share.
Analyzing Results and Lessons Learned
After earnings, let’s say TGI reports slightly better than expected and closes at $148. Both puts expire worthless. I pocket the $0.75 credit. Success!
Alternatively, maybe TGI misses expectations and closes at $143. The $145 put I sold is now in the money, worth about $2.00. The $140 put I bought is out of the money and worthless. My initial credit was $0.75. So, I’m looking at a loss of $1.25 ($2.00 value of sold put – $0.75 credit). This is less than my maximum potential loss, which is good.
The key takeaway here is that with weekly options, especially around earnings, you’re playing a short game. Timing is everything, and you need to be precise. While the potential for quick profits is there, the risk of rapid losses due to time decay or unexpected price swings is also significant. It’s not about predicting the exact price, but rather the direction and magnitude of the move within a very tight window.
This example shows how a credit spread can offer a defined risk and reward profile for earnings plays. It’s a way to get paid for taking on a specific risk, and it worked out in this case. But remember, every earnings event is different, and thorough research is always needed.
Want to see how options trading works in real life? We break down a weekly options earnings example to show you exactly how it’s done. It’s easier than you think to get started. Ready to learn more and boost your trading skills? Visit our website today to explore more examples and begin your journey to financial success!
Wrapping Up Your Weekly Options Strategy
So, we’ve looked at how weekly options can offer quick chances to trade around big events like earnings. It’s not always easy, and you have to be smart about it. Using the right tools, like understanding chart patterns and key indicators, can really help. Remember, managing your money is super important; don’t bet too much on any single trade. Practice makes perfect, so try things out in a demo account before you put real cash on the line. Stick to your plan, manage your risks, and you’ll be in a better spot to see some good results with these fast-moving options.
Frequently Asked Questions
What exactly are weekly options?
Think of weekly options like super-fast bets on stocks. Unlike regular options that give you a whole month to be right, weekly options give you just one week. They expire every Friday. Because they’re so short-term, they cost less upfront but can lose value much faster if the stock doesn’t move the way you expect.
Why are weekly options good for earnings season?
Earnings season is when companies share their latest money reports, and this often causes big, quick price swings in the stock. Weekly options are perfect for this because their short life means you can try to grab profits from these rapid price changes. You can make a bet on whether the stock will jump up or down right after the earnings news.
How do I pick the right stocks for weekly options trades?
It’s smart to focus on stocks that lots of people are already trading, especially big tech companies or popular ETFs. These stocks tend to have more activity and clearer price movements, making it easier to find opportunities with weekly options. Also, look for stocks that historically move a good amount during earnings.
What’s ‘implied volatility’ and why does it matter for weekly options?
Implied volatility is like a guess of how much a stock’s price might bounce around in the future. Before earnings, this guess often gets really high because people expect big moves. After the news is out, this ‘guess’ usually drops fast. Traders watch this to figure out if option prices are too high or too low before making a move.
What are some simple strategies for using weekly options during earnings?
One way is to sell ‘covered calls’ if you already own the stock, which can earn you some extra money from the option’s price. Another is to use ‘credit spreads’ if you have a hunch about which way the stock will go. For times when you think the stock will stay in a certain price range before earnings, ‘iron condors’ can be useful.
How can I avoid losing too much money with weekly options?
It’s super important to be careful. Always decide beforehand how much you’re willing to lose and set a ‘stop-loss’ order to automatically sell the option if it drops too much. Also, don’t trade too often, and try not to get too excited about small, quick gains, as this can lead to bigger losses.