
Setting up TradingView for options trading can feel a bit overwhelming at first, but once you get the hang of it, the process is pretty straightforward. Whether you’re brand new or just want to fine-tune your workspace, this step-by-step guide will walk you through everything you need. From picking the right subscription to customizing your charts and building watchlists, I’ll show you how to make TradingView work for your options strategies. By the end, you’ll have a workspace that fits your style and helps you stay focused on your trades.
Key Takeaways
- You can start with a free TradingView account and upgrade later if you need more features for options trading.
- Customizing your chart layout and saving templates makes it easier to spot trends and stick to your trading plan.
- Adding core indicators and drawing tools helps you analyze options setups more clearly.
- Setting up watchlists and alerts saves time and keeps you on top of market moves without staring at the screen all day.
- Trying out paper trading and custom strategies in TradingView lets you test ideas before risking real money.
Creating and Customizing Your TradingView Account for Options
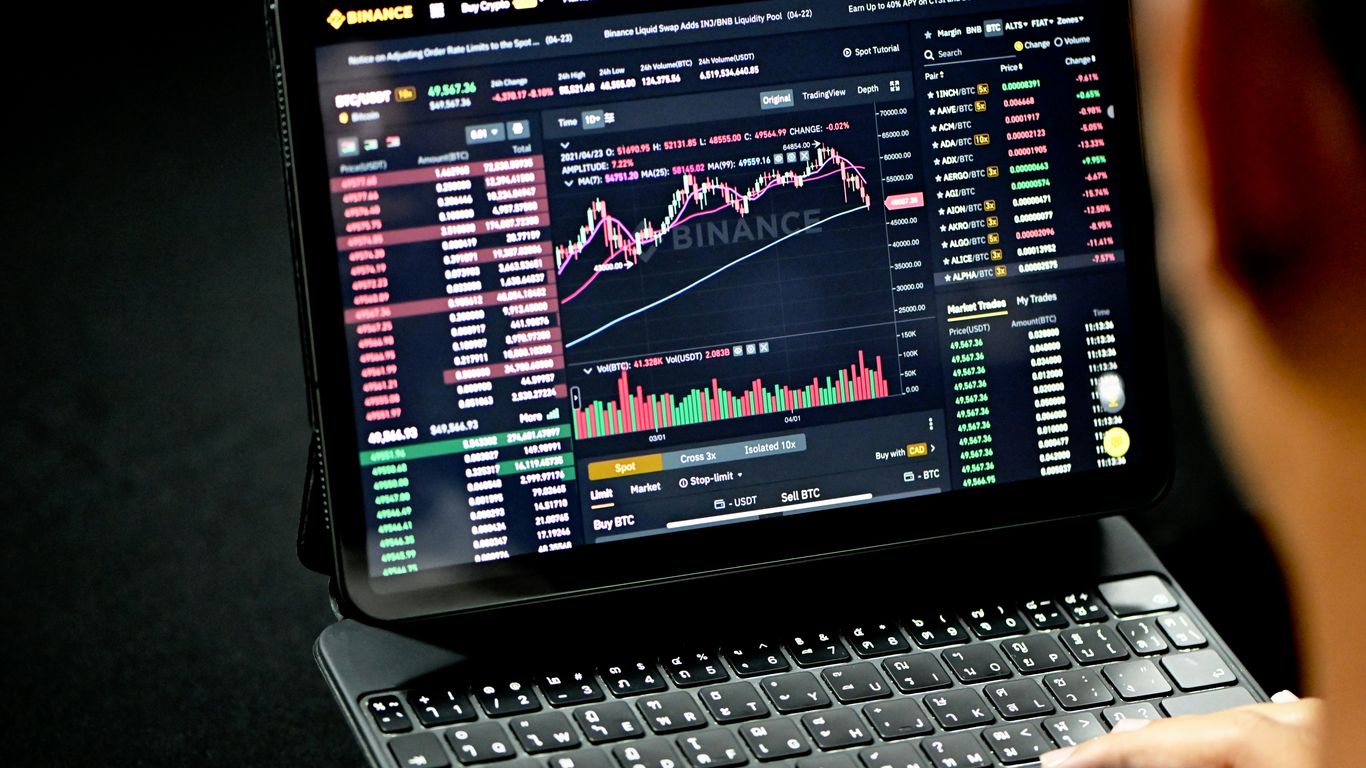
Setting up TradingView with options trading in mind is easier than you might expect, but there are a few choices you’ll want to make from the start.
Choosing the Right TradingView Subscription
Before you start adding charts or indicators, picking your subscription level matters. Not every plan is the same, and some options analysis features aren’t available on the basic tiers.
Here’s a simple comparison:
| Plan | Key Features |
|---|---|
| Free | 1 chart per layout, 3 indicators, ads |
| Pro | 2 charts/layout, 5 indicators, fewer ads |
| Pro+ | 4 charts/layout, 10 indicators, extra tools |
| Premium | 8 charts/layout, 25 indicators, priority support |
If you want to monitor multiple options symbols or use advanced alerts, a paid plan quickly becomes worth it.
Setting Up Profile and Preferences
Once you’re registered, don’t rush past your profile. Taking a few minutes here will make analyzing options so much smoother later.
- Set your time zone to match your main trading hours—nothing is more annoying than missed alerts due to time mismatch.
- Choose a username that you like; you might end up sharing watchlists or scripts.
- Update your notification preferences so you get alerts where you want: via email, on mobile, or desktop pop-ups.
- Toggle on two-factor authentication for extra security.
- Add your brokerage details if you plan to trade directly from TradingView.
- Pick your default language and region; some features and news feeds are region-specific.
Getting these details right now means less hassle and fewer mistakes when you’re in the thick of trading later on.
Optimizing Theme and Layout
TradingView’s look is super customizable. For options, you often need to review a lot of charts and data at a glance:
- Switch between light and dark mode to reduce eye strain on long days.
- Arrange panels so your favorite tools are always within one click.
- Save preferred layouts once you’ve got everything set up, so you can toggle between them for different strategies or workflows.
A bit of time fine-tuning your workspace can make your analysis feel a lot more natural—and less like a puzzle every session.
Configuring Charts for Effective Options Trading
Setting up your TradingView charts for options trading isn’t just about looks—it’s about making them work for your style and decision-making. Getting the setup right helps you spot trades, limit mistakes, and act faster. Let’s break it down into the steps that matter most.
Selecting Chart Types and Timeframes
Choosing your chart type is like picking the right tool for a job. Whether you like candles, bars, or something different, each has its own vibe for options:
- Candlestick Charts: Show open, high, low, close data for each period—great for reading patterns and momentum.
- Bar Charts: Offer similar data but in a slimmer format. Some traders find these less cluttered than candles.
- Heikin Ashi: Smooths price action, good for highlighting trends and keeping you focused on the bigger picture.
When it comes to timeframes, options traders usually switch between several to plan entries and exits—think 1-minute for quick plays or daily for longer swings. Don’t be afraid to toggle and see what fits your approach.
| Chart Type | Best Use Case | Info Level |
|---|---|---|
| Candlestick | Spotting reversals/patterns | High |
| Bar | Clean trend analysis | Medium |
| Heikin Ashi | Trend clarity, smoothing | Moderate |
Customizing Chart Appearance and Style
A chart that matches your preferences can actually help you interpret what’s going on faster. You can play with gridlines, candle colors, and even the background—right-click on the chart and open up “Settings.”
Some ideas for customizing:
- Adjust candle colors for bullish and bearish moves.
- Choose light or dark backgrounds—whatever helps reduce eye strain.
- Hide unnecessary lines or overlays to keep things clear.
Sometimes, the tiniest tweaks make all the difference. A chart that feels right is a chart you’ll actually want to use.
Saving Chart Templates for Consistency
There’s nothing worse than spending ages making a perfect chart, only to lose all those settings next time you log in. Save yourself the headache and create chart templates.
Here’s a simple way to lock in your setup:
- Once you’ve got everything dialed in, head to the template section in your chart menu.
- Click “Save as Template” and give it a name related to your options strategy or timeframe.
- Next time, just load your template—no need to start from scratch.
Keeping consistent visual cues helps streamline your process, lowers confusion, and builds confidence, which is key when trading options. If you’re looking to boost your confidence even more, focusing on technical analysis foundations like indicator use and chart reading can really help, as building confidence in options trading is an ongoing process.
Essential Tools and Indicators for Options Analysis
A big part of options trading on TradingView is setting up the right technical indicators. The platform’s library has hundreds available, but not all deserve a spot on your chart. It’s easy to get carried away, but focusing on a few basics will keep your analysis clear and your signals sharp.
Here’s a quick rundown of the must-haves:
- MACD: This tool helps you spot changes in momentum. Watch for crossovers—they hint at possible reversals.
- RSI (Relative Strength Index): RSI tells you when a stock’s price might be stretched too far; above 70 is usually overbought, under 30, oversold.
- Moving Averages (like EMA/SMA): These smooth out noise, showing the general trend.
Custom scripts, shared within the TradingView community, add even more ways to approach options analysis. If you’re into experimenting, try ones labeled “Editors’ Picks”—these are popular for a reason.
It’s easy to start with indicators, but don’t overload your chart; too many lines or numbers can make things more confusing than helpful.
Leveraging Drawing Tools for Options Strategies
Options strategies often rely on visualizing entry points, strike prices, and risk zones. TradingView gives you a stack of drawing options for this, including:
- Trendlines to map out where a price might go or bounce.
- Rectangles and circles for highlighting price ranges you’re watching.
- Fibonacci retracements, especially for finding where moves might pause or reverse.
These tools help you plot possible outcomes, making strategy like the iron condor or straddle simpler to visualize.
You’ll also find text notes handy for marking trade ideas, especially if you want to revisit why you set up a trade a certain way. Interactive drawing features save time and cut down on second-guessing.
Integrating Volatility and Volume Indicators
With options, volatility means everything. To get a better grip, plug in indicators like:
- Average True Range (ATR): Shows how much an asset swings in price. If ATR jumps, expect wilder moves—something every options trader wants to know.
- Volume Profile: Lays out where buyers and sellers are stacked up. Helps you spot potential support or resistance.
- Implied Volatility: This isn’t standard but can be found through custom scripts or extra tools on TradingView. Implied volatility helps set expectations for premium pricing and possible price swings.
| Indicator | What It’s For | Key Benefit |
|---|---|---|
| ATR | Measuring price swings | Flags when markets heat up |
| Volume/Volume Profile | Seeing market activity | Finds strong price levels |
| Implied Volatility | Gauging market expectations | Prices in possible movement |
If you’re trading options short-term, using these real-time analytics is especially helpful for testing strategies and limiting losses. Explore more about strategy builders and advanced trading tools that let you simulate scenarios and tweak risk settings before you place a trade.
Keep your toolbox lean and focused. The right combination of technical, drawing, and volatility tools makes your options analysis clearer and trading decisions more solid—without cluttering your screen.
Building and Managing Watchlists and Alerts
Options traders have to keep tabs on many tickers at once. Organized watchlists and smart alerts help you spot the next move without staring at charts all day. In this section, we’ll get into building custom watchlists, setting up alerts, and fine-tuning how TradingView reaches you so you never miss a setup.
Creating Options-Specific Watchlists
Forget flipping through endless tickers. Setting up specialized watchlists makes tracking your favorite options a lot easier. Here’s how to do it:
- Click the "Watchlist" panel (left side of TradingView).
- Hit the "+" button to create a new list—name it something like “Weekly Calls” or “Iron Condors.”
- Add tickers you care about: type in the stock symbol, then choose the right expiration and strike if you’re watching options chains.
- Drag your most traded options to the top for quick access.
- Delete or move tickers as your focus changes.
A purpose-built watchlist cuts out noise and lets you react faster to the contracts and stocks that matter for your strategy.
Setting Up Price and Indicator Alerts
You don’t have to be glued to your screen. TradingView’s alert tools let you know when your conditions hit, so you act only when needed. Here’s the quick way to set them up:
- On your chart, click the bell icon 🔔 at the top or just press Alt+A on Windows (or Option+A for Mac).
- Select the alert condition—this could be price crossing a level or an indicator like RSI moving outside your chosen range.
- Decide if you want the alert to happen just once, or every time the condition is met.
- Pick your preferred notification: popup, email, or push to your phone.
- Confirm and create. That’s it—now you’ll get an alert when the market hits your setup.
TradingView also allows you to manage your alerts through the Alert manager tool, keeping your notifications clear and organized.
Example Alert Types You Can Create
| Alert Type | When it Triggers |
|---|---|
| Price Levels | Price goes above/below target |
| RSI/Indicator Value | Indicator crosses certain boundary |
| Drawing Tools | Price interacts with lines/zones |
Customizing Notification Preferences
Getting too many (or too few) alerts can work against you. Adjust your alerts to fit your routine:
- Open the "Alerts" tab to see all active alerts.
- Click the gear icon to edit notification settings.
- Tailor how you’re contacted—turn on push notifications for urgent setups, or just email for longer-term swings.
- Consider refining messages; write short, specific text for each that tells you why the alert fired.
Making sure your alerts work for you—without becoming a nuisance—will help you move faster and smarter in the options market.
Utilizing Advanced Features to Enhance Options Trading
TradingView isn’t just about looking at charts and drawing a few lines. If you’re working with options, you’ll find that advanced features can really smooth out your trading process. Let’s break down some of the top tools you should check out.
Working with Multi-Chart Layouts
Being able to see several timeframes or compare related assets at once is super helpful. Multi-chart layouts let you:
- Track an underlying stock alongside its options chain
- Compare different expiration dates or strike prices
- Monitor volatility and market news next to price action charts
You can set up your screen to show, for example, a daily and an hourly chart for the same stock. That way, you can spot big-picture trends and drilling into the details for a trade setup, all without clicking away to another tab.
When you put multiple charts side by side, making sense of conflicting signals gets a lot easier. It helps you avoid tunnel vision and catch both the trend and any short-term risks.
Exploring Stock and Options Screeners
If you’re scanning dozens or even hundreds of assets, you’ll want a screener.
TradingView lets you filter stocks by:
- Implied volatility
- Technical signals (like RSI, MACD)
- Price movement over different periods
Here’s a small sample of what you can screen for:
| Filter | What It Tells You |
|---|---|
| Implied Volatility | Potential premium levels |
| Unusual Options Volume | Possible upcoming moves |
| Technical Breakouts | Chance for short-term trades |
Instead of spending hours flipping through charts, use the screener to find targets that match your options strategy, whether you’re after high volatility for selling premiums or looking for a breakout to ride with calls or puts. This is similar to what many seasoned options traders rely on for quick and accurate decisions.
Practicing with Paper Trading Accounts
Maybe this is obvious, but don’t skip paper trading—especially for a new options strategy. It’s risk-free and lets you get used to the quirks of TradingView’s order system. You can:
- Develop muscle memory for placements
- Test different options setups (spreads, butterflies, etc.)
- Track how often your signals work—without losing actual cash
Paper trading lets you see your mistakes and successes (and keeps your ego in check) before you trade real money. This is one of those features people often skip, but it’s probably the easiest way to build real confidence.
All in, these advanced features may take a little time to set up, but they give options traders a real edge. Custom layouts, strong screeners, and no-pressure simulated accounts all come together to make trading smarter and less stressful.
Designing and Testing Custom Strategies in TradingView
Want to really see how your options strategy might hold up? TradingView’s custom strategy tools let you go beyond the basics. This is where you get to experiment, tweak, and actually see some results—without risking real money.
Getting Started with Pine Script
If you’re new to Pine Script, don’t stress—it’s built just for TradingView and doesn’t require a computer science degree. Pine Script makes it possible to create your own indicators and strategies, perfectly tailored for options trading. Here’s how you might approach it:
- Go to the Pine Script editor at the bottom of your TradingView screen.
- Start with something simple: write a script that signals a basic moving average crossover.
- Test your code by adding it to any chart—TradingView gives instant feedback about signals.
Want to push further? Try customizing your script with strike prices, implied volatility, or other option-specific variables.
Backtesting Options Strategies
Backtesting gives you the power to see if your idea would have worked before putting any cash on the line. Take advantage of the built-in Strategy Tester:
- Select your custom (or any available) strategy in TradingView.
- Set the relevant ticker and timeframe.
- Run the test and study the results table, which typically includes:
| Metric | Description |
|---|---|
| Net Profit | Total gains or losses over the period |
| Win Rate | Percentage of trades that were profitable |
| Max Drawdown | Largest observed drop in equity |
| # of Trades | How often your strategy triggered |
You quickly see where the weak spots are—or maybe, where you have a winner.
Many folks start out excited, but it’s the backtesting phase that shows if your strategy stands a chance in real markets. Don’t skip it!
Applying Strategy Tester with Real Data
Once you’ve coded and backtested your strategy, seeing it on actual historical charts makes all the difference. Here’s what you do:
- Pick the security, timeframe, and date range that match your options strategy focus.
- Apply the strategy and watch as TradingView plots simulated entries and exits.
- Analyze the report for details like trade distribution, equity curve, profit factor, and more.
To improve, try adjusting your parameters—like changing your moving average period or entry conditions—and retest. You’ll probably find that a few tweaks lead to big changes in performance.
For more on growing your options trading skills, especially as a beginner, building custom strategies combines well with practicing simple approaches like covered calls or cash-secured puts. It’s a smart way to gather experience before moving on to more advanced methods—just like suggested in this beginner options strategies overview.
By exploring Pine Script, regularly backtesting, and using historical data, you start to break down what’s working, what isn’t, and how each adjustment makes a difference. That’s real progress.
Personalizing Your Workspace for Optimal Performance
Making your TradingView workspace suit your style helps you feel more at home during analysis. Even small tweaks can make a big difference day-to-day. Let’s break down a few easy but powerful ways to shape your chart setup so it works for you.
Customizing Status Line and Ticker Settings
Sometimes, you only want to see what’s most useful—like the price and ticker for active trades. Others might prefer the cleanest look possible. Here’s how to get it set just right:
- Click the gear icon (⚙️) on the chart.
- Go to the "Status Line" tab.
- Choose what details show up at the top of your chart: ticker symbol, price, logos, or nothing at all.
- Save your changes to keep your chart view the way you like it.
Fine-tuning these options brings focus, removing extra info that just gets in the way.
Adjusting Price Axes and Chart Backgrounds
Changing the look of your price scale and background makes your workspace easier to read when the market is moving fast. Want indicator names, the last trade price, or special colors? You can set those just how you like:
- Open "Settings" then the "Scales" tab to control what’s visible on the price axis: last traded price, high/low, and indicator names.
- Tweak your background color and grid line styles for comfort—especially helpful for long sessions.
- Use the "Appearance" tab to set candle colors, backgrounds, and grid options.
A good workspace lets you spot setups quickly and keeps your eyes comfortable for those longer trading days.
Organizing and Saving Multiple Layouts
If you switch between different asset classes or strategies (like moving from stocks to options), saving multiple chart layouts will save you a ton of time.
- Hit the layout icon at the top, then "Save Layout As" to name and save your current setup.
- You can create separate profiles for different strategies or markets (for example, one for short-term options, one for weekly moves, and one for equities).
- TradingView remembers your indicators, layouts, and watchlists for each layout.
Here’s a quick table showing possible layout setups for different option scenarios:
| Layout Name | Asset Class | Purpose |
|---|---|---|
| Weekly Options | Options | Monitor Friday expiry |
| Macro Stocks | Equities | Track index levels |
| Volatility Scan | Options/Futures | Volatility watch |
Using these features can be paired with advanced platforms that offer things like bracket orders, custom strategy templates, and real-time alerts—see how an advanced trading platform offers layout and risk management tools.
The time you spend setting up the workspace will pay itself back every time you log in—so don’t rush it, and don’t be afraid to experiment.
Make your workspace your own so you feel good and work better. Even small changes like adding your favorite colors or pictures can make a big difference. Want more tips on reaching your best? Visit our site and see how you can boost your success today!
Wrapping Up Your TradingView Options Setup
So, that’s pretty much it for getting started with TradingView for options trading. At first, all those menus and settings might seem a bit much, but once you poke around and set things up the way you like, it gets easier. The best part is you can try out different chart styles, add your favorite indicators, and even test out strategies without risking real money. Don’t stress if you don’t get everything perfect on the first go—most traders tweak their setup as they go along. Just keep exploring, and soon enough, you’ll have a workspace that fits your style. If you ever get stuck, there are tons of guides, videos, and even a helpful community right on TradingView. Good luck, and happy trading!
Frequently Asked Questions
Can I use TradingView for options trading even if I’m a beginner?
Yes, TradingView is great for beginners! It has an easy-to-use layout and lots of guides. You can start with a free account and learn the basics before moving to more advanced features.
What’s the difference between the free and paid TradingView plans?
The free plan gives you access to most charting tools and basic indicators. Paid plans like Pro, Pro+, and Premium let you use more charts, extra indicators, and advanced features like multiple alerts. You can try a free trial before deciding to upgrade.
How do I make my charts look the way I want in TradingView?
You can change the chart style, colors, and background by clicking the settings gear on your chart. There, you can adjust things like candle colors, grid lines, and even switch between light and dark themes.
Can I save my chart setups for later use?
Yes! After you customize your chart, you can save it as a template. This way, you can load your favorite settings quickly for any asset you want to look at.
Is it possible to practice trading in TradingView without using real money?
Absolutely. TradingView offers a paper trading feature, which lets you practice buying and selling without risking any real cash. It’s a great way to test your strategies and learn how trading works.
How do I set up alerts for price changes or indicators in TradingView?
To set up an alert, just right-click on the chart or use the alert button at the top. You can choose to get alerts for price movements, indicator changes, or even custom conditions. Alerts can be sent to your phone, email, or shown on the screen.